MacroSnaps19 October 2026
No. 100Americans feel worse about the economy than at any point in the 2008 financial crisis. They are also spending more per person than ever.
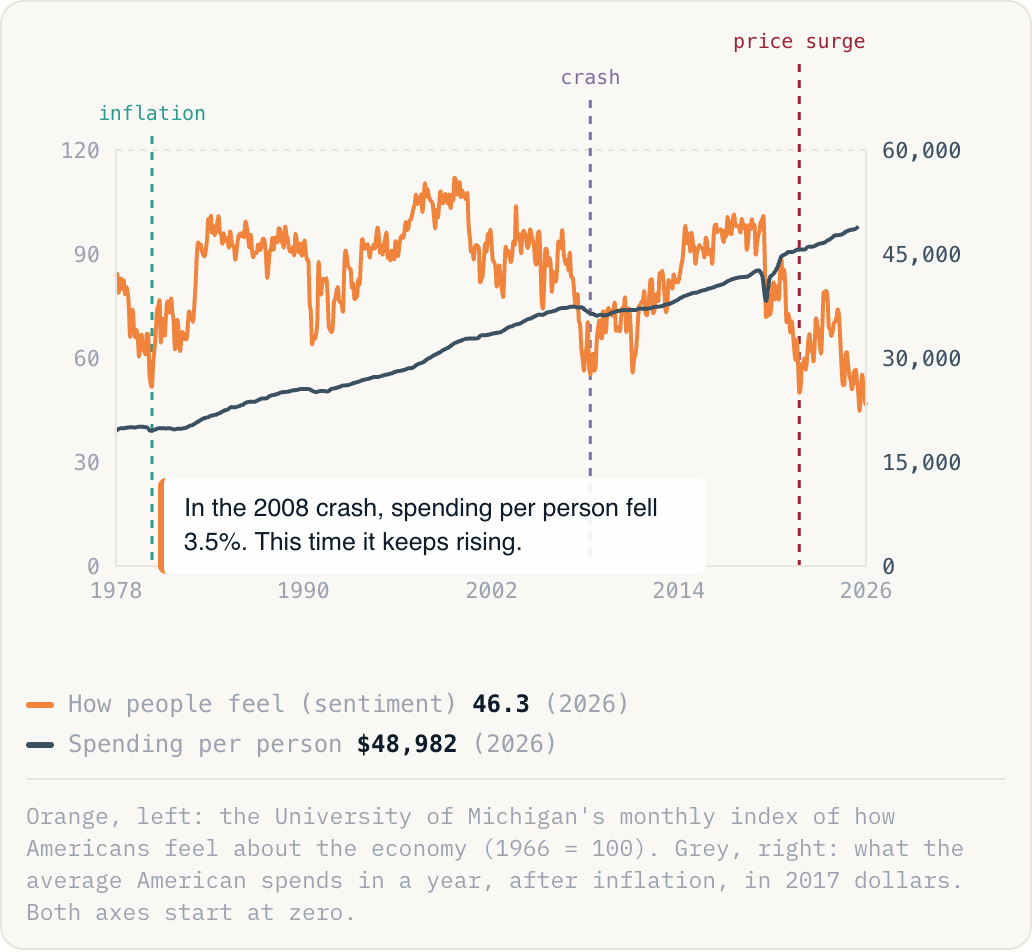
In the 2008 crash, spending per person fell 3.5%. This time it keeps rising.
How people feel (sentiment)46.3(2026)Spending per person$48,982(2026)
Orange, left: the University of Michigan's monthly index of how Americans feel about the economy (1966 = 100). Grey, right: what the average American spends in a year, after inflation, in 2017 dollars. Both axes start at zero.
Why this is happening
- What people say. Michigan surveys Americans every month about their finances and the economy. In October their rating of conditions today hit a record low. The complaint is prices: they are 30% higher than in early 2020, and fuel has jumped since the Iran conflict began in February.
- What people do. Spending per person, after inflation, hit a record in the spring and was still rising in August. Unemployment is a low 4.2%. Pay outran prices from 2023, though it has slipped behind them this year.
- Who is spending. Not everyone equally. The richest tenth of households, buoyed by stock market gains, now account for about half of all spending (Moody's Analytics). Lower-income households drove October's fall in mood.
The take
For decades, a slump in mood went with a slump in spending: both fell in 1980 and 2008. That link has broken. Sentiment hit a record low in 2022 and no recession followed. So a gloomy survey is no longer a good forecast of a downturn. Watch what people spend and whether they keep their jobs. If spending starts to fall, the gap closes, and the gloom will have been right.