MacroSnaps20 October 2026
No. 101After two world wars, inheritance in France, Britain and Germany shrank to a fraction of its old size. It has been climbing back ever since.
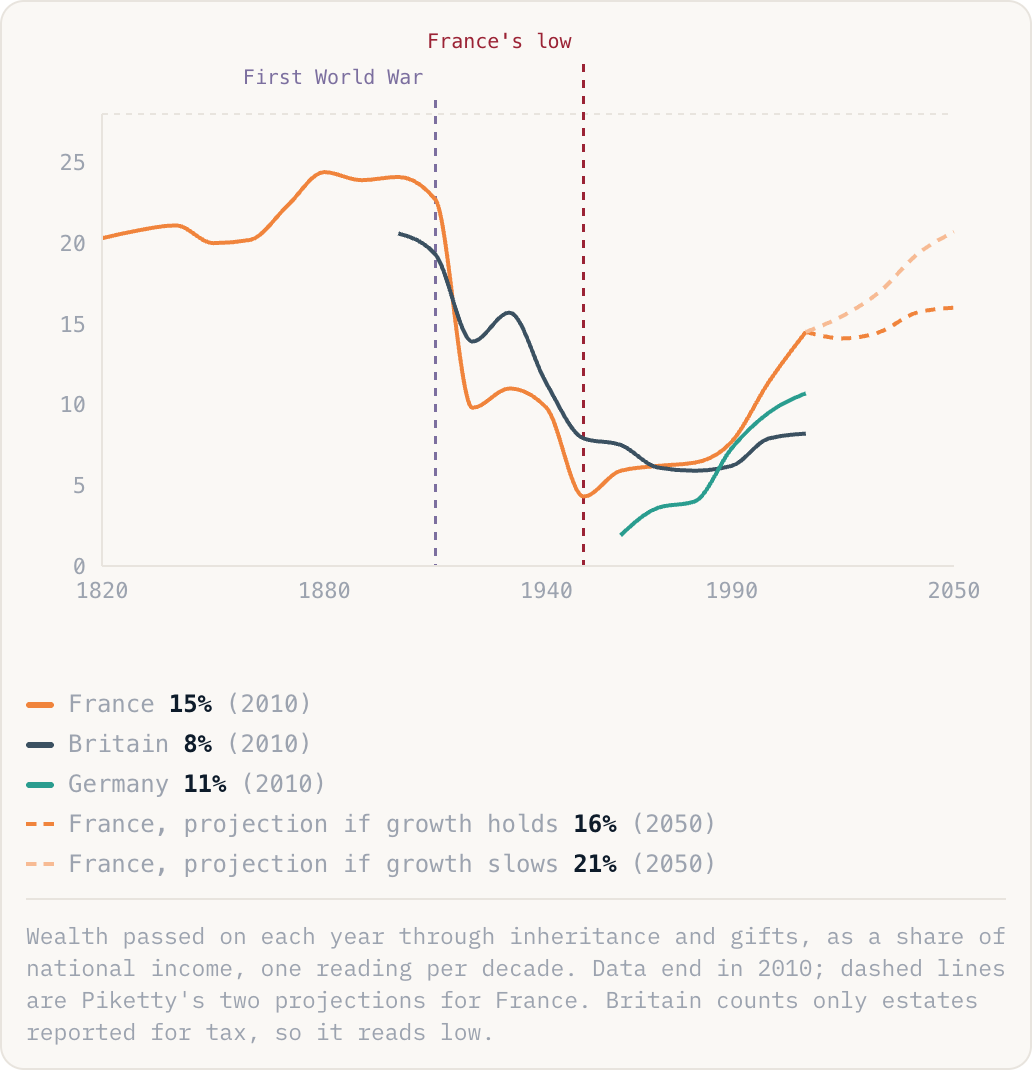
France15%(2010)Britain8%(2010)Germany11%(2010)France, projection if growth holds16%(2050)France, projection if growth slows21%(2050)
Wealth passed on each year through inheritance and gifts, as a share of national income, one reading per decade. Data end in 2010; dashed lines are Piketty's two projections for France. Britain counts only estates reported for tax, so it reads low.
Why this is happening
- The collapse was not natural. Wars destroyed buildings and factories, inflation wiped out savings held in bonds, and then very high taxes (Britain's top rates on income and estates went above 70%) stopped fortunes rebuilding. The flat stretch after 1950 is the unusual period, not the norm.
- Since then, three things have pushed it back up. Houses and shares have grown faster than wages for 40 years. People live longer, so estates are bigger when they pass. And top tax rates on estates have fallen almost everywhere.
- Germany fell furthest, from 16% of national income in 1910 to 2% in 1960, and has risen fastest since, to 11% by 2010. France has more than tripled from its low.
The take
For French people born around 1910, inheritance made up a tenth of all the money they would get in a lifetime; the rest came from work. For those born in the 1970s it is over a fifth, close to the 19th-century level. More than one in ten of them will inherit more than the poorer half of the country earns in a whole working life. The mid-century world where your pay decided your life was the exception.