For 66 years, the United States bought more energy from abroad than it sold. Since 2019 it has sold more than it buys.
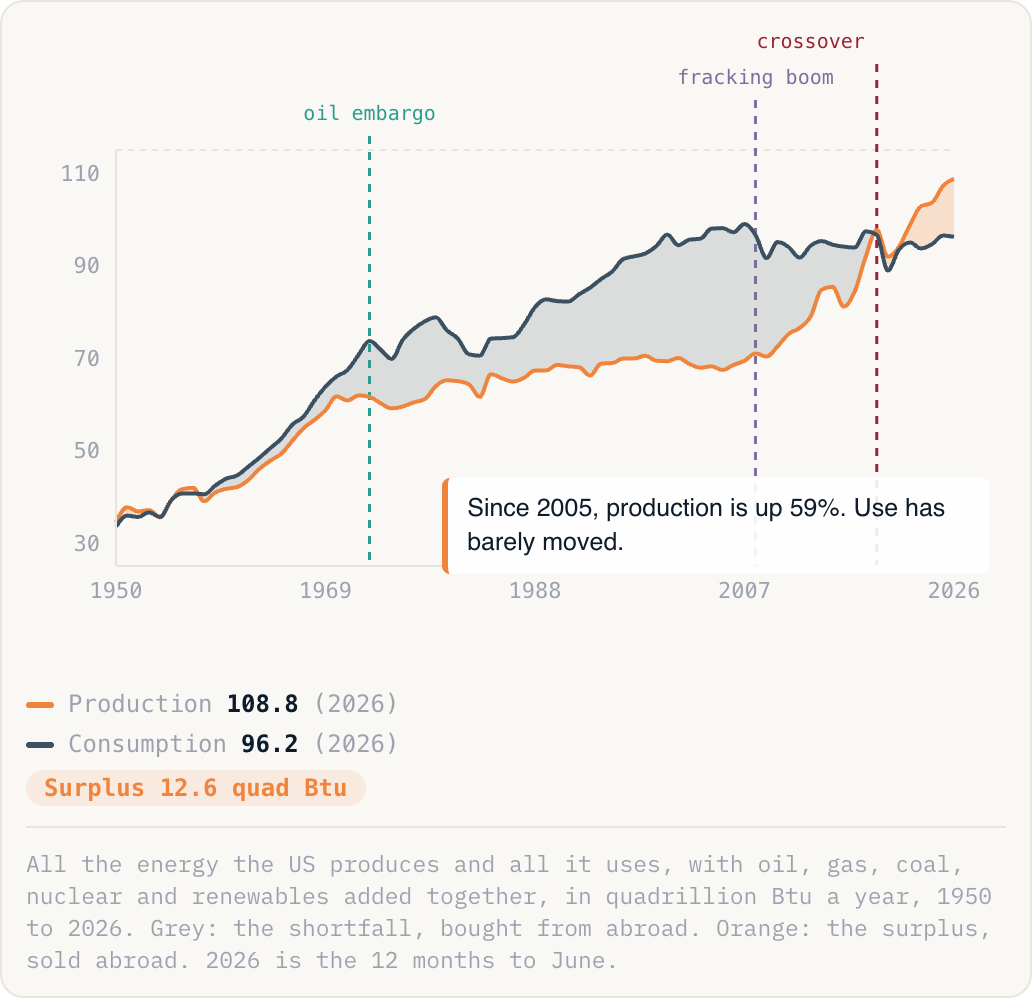
All the energy the US produces and all it uses, with oil, gas, coal, nuclear and renewables added together, in quadrillion Btu a year, 1950 to 2026. Grey: the shortfall, bought from abroad. Orange: the surplus, sold abroad. 2026 is the 12 months to June.
- What changed. From 2008 drillers learned to crack open shale rock by drilling sideways and pumping in water and sand under pressure (fracking). The US is now the world's biggest producer of both oil and gas.
- Use stopped growing. Americans used less energy in 2025 than in 2007, despite about 40 million more people. Cars, lights and power plants got more efficient, and gas replaced coal in power stations.
- What it sells. Mostly gas, chilled into liquid (LNG) and shipped, plus diesel, petrol and coal. This week Taiwan said it plans to buy 6 million tonnes of LNG a year from a planned Alaska project. The US still buys more crude oil than it sells, mostly from Canada.
This is why the current oil spike lands differently. The US energy agency now expects the world oil price (Brent) at $105 a barrel from October to December, up from $91 in last month's forecast. A study by Harvard's James Stock and colleagues finds oil shocks used to shrink the US economy and now give it a small lift. Drillers, their shareholders and oil states such as Texas gain; drivers and airlines pay. A price jump no longer makes the country as a whole poorer. It moves money from drivers to drillers. So the argument in Washington is shifting from protecting the country to deciding who should bear the cost.