MacroSnaps17 October 2026
No. 98A century ago food ate over 40% of the American household budget; today it is barely an eighth.
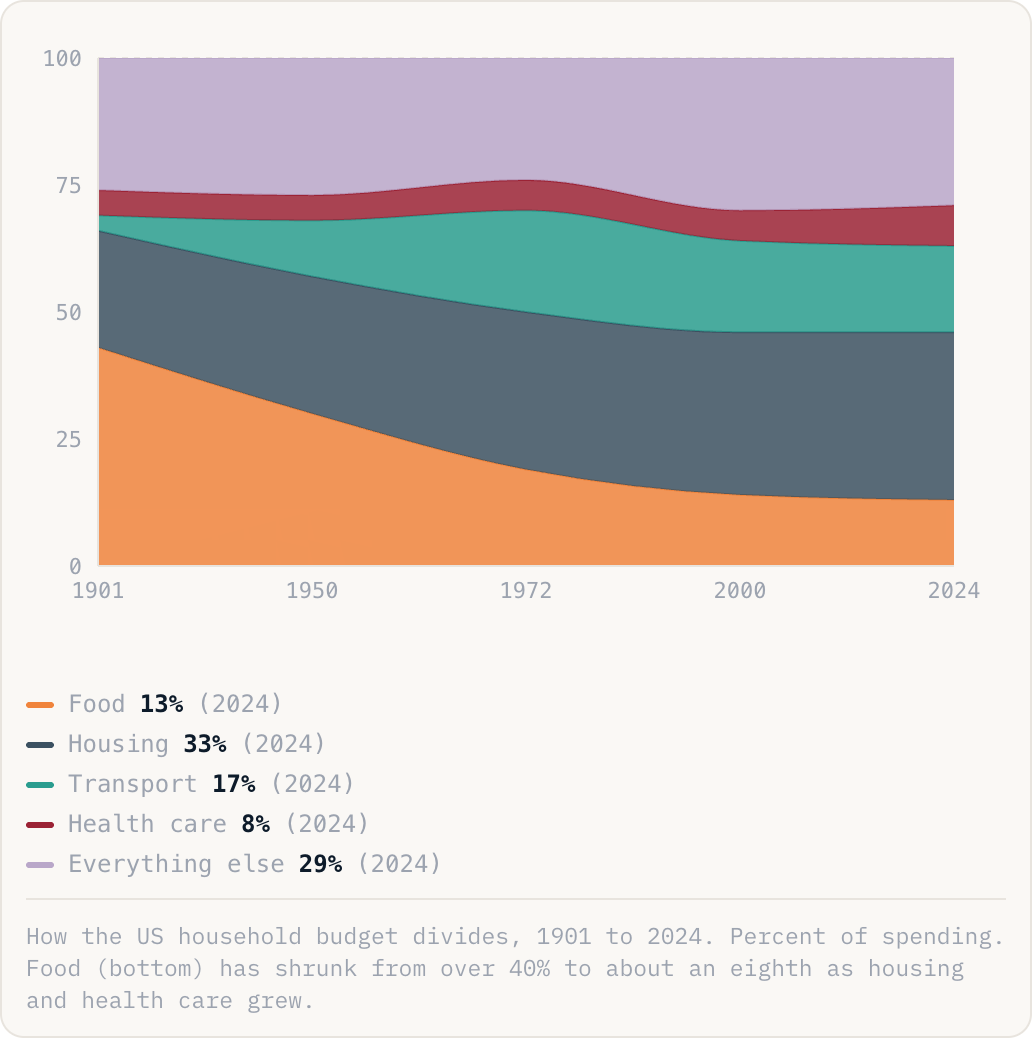
Food13%(2024)Housing33%(2024)Transport17%(2024)Health care8%(2024)Everything else29%(2024)
How the US household budget divides, 1901 to 2024. Percent of spending. Food (bottom) has shrunk from over 40% to about an eighth as housing and health care grew.
Why this is happening
- Farm productivity exploded: mechanisation, fertiliser, hybrid seeds and better logistics meant ever fewer farmers fed ever more people, so food got cheaper in real terms decade after decade.
- Incomes rose far faster than food prices, so even as families ate more and ate out more, food shrank as a slice of the budget.
- What food gave up, housing and health care took: both claim a bigger share of the budget than they did a century ago.
The take
The quiet miracle of farm productivity freed up most of a household budget for everything else, the foundation of the modern consumer economy. When food stops eating your paycheque, you can buy a life.