MacroSnaps24 September 2026
No. 75Nearly 7% of Americans with weaker credit are two months behind on their car loan, the most in over 30 years. Among stronger borrowers it is under half a percent.
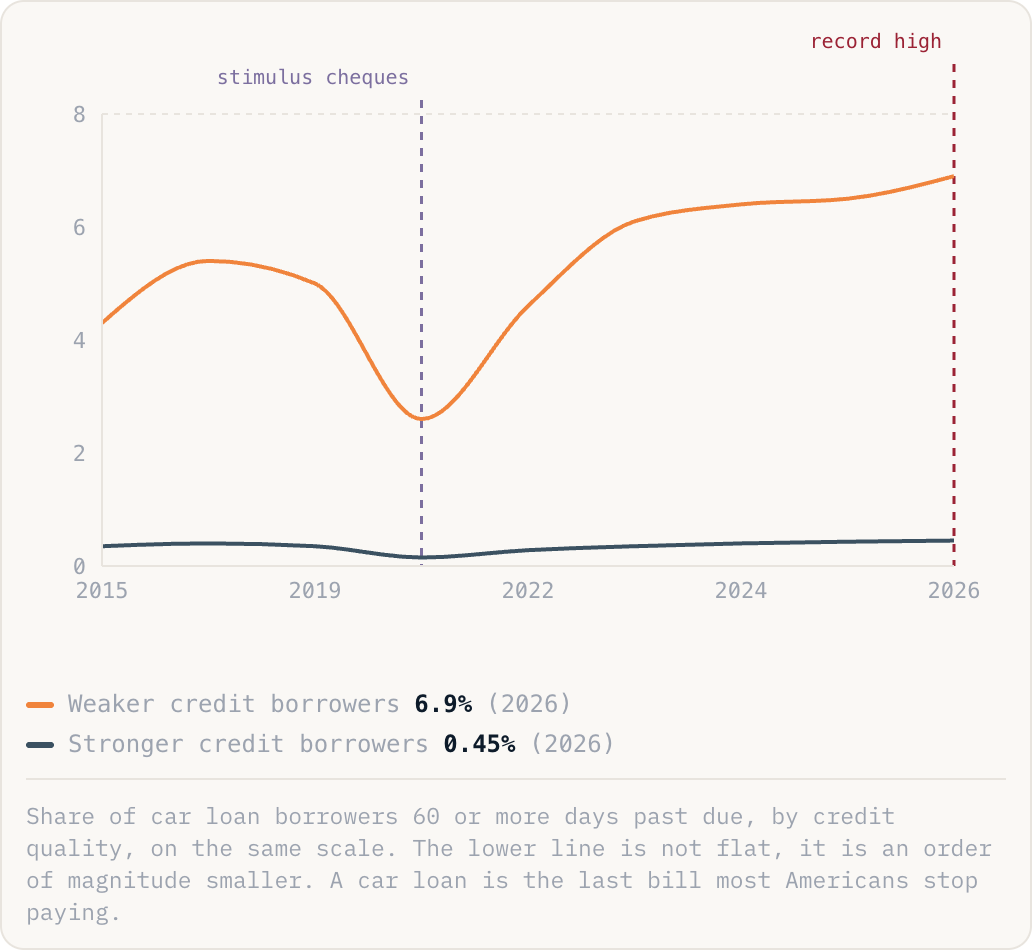
Weaker credit borrowers6.9%(2026)Stronger credit borrowers0.45%(2026)
Share of car loan borrowers 60 or more days past due, by credit quality, on the same scale. The lower line is not flat, it is an order of magnitude smaller. A car loan is the last bill most Americans stop paying.
Why this is happening
- The people at the top own assets, and assets have had an extraordinary decade. Shares and house prices rose far faster than wages, so households that already owned things got much richer without earning more.
- The people at the bottom rent and borrow. They got the same inflation in rent, insurance and food without the offsetting gains, and their debts are on floating or high fixed rates set during the rate rises.
- A car loan is a good early warning because in most of America a car is how you get to work. It is the last bill people stop paying, so when this line moves, real distress is already well established underneath it.
The take
Aggregate statistics can be simultaneously accurate and useless. Consumer spending looks solid, and it is, because the top tenth of earners now account for close to half of it, so their spending can carry the average while everyone else is quietly falling behind. When people say the economy is fine and other people say it is not, they can both be reading the numbers correctly.