A bitcoin mined in 2013 took less electricity than a single home uses in a year; one mined last year took as much as 460 homes.
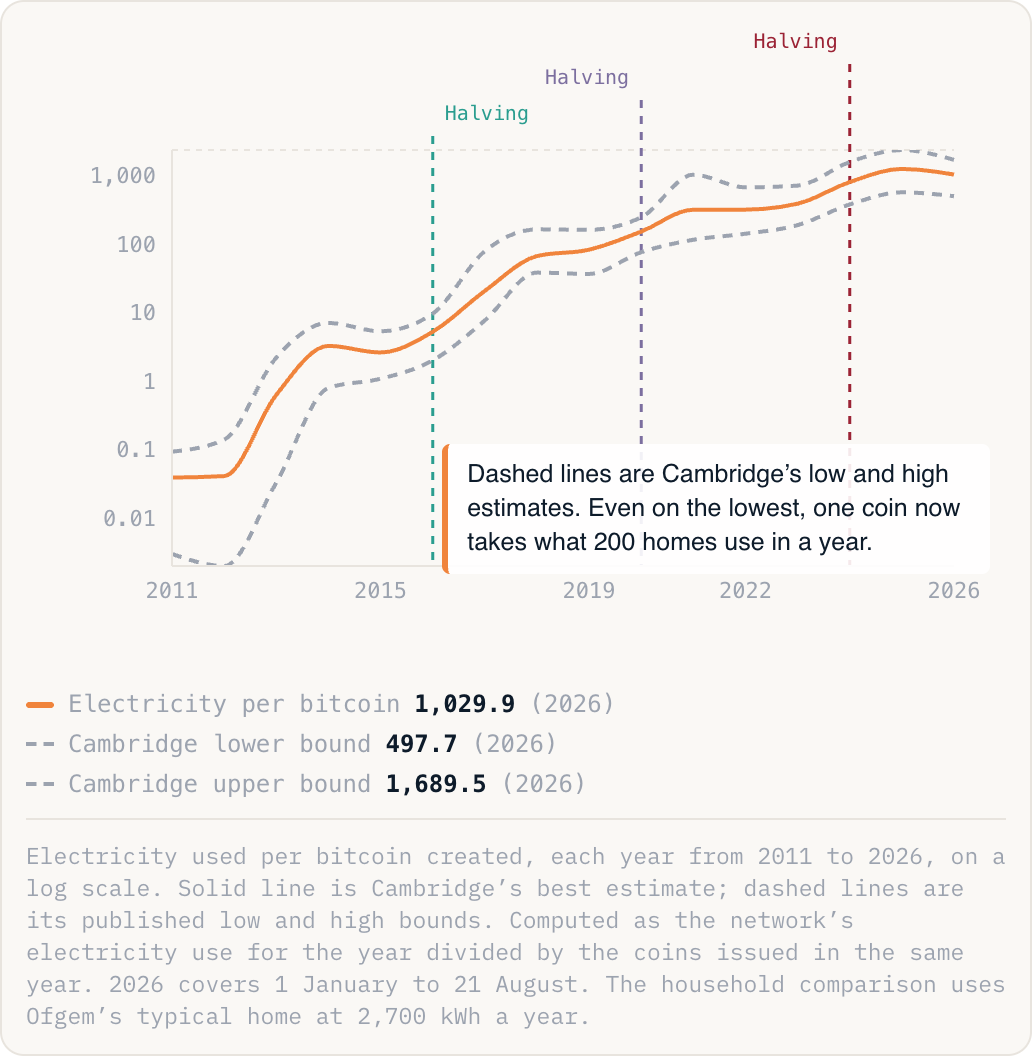
Electricity used per bitcoin created, each year from 2011 to 2026, on a log scale. Solid line is Cambridge’s best estimate; dashed lines are its published low and high bounds. Computed as the network’s electricity use for the year divided by the coins issued in the same year. 2026 covers 1 January to 21 August. The household comparison uses Ofgem’s typical home at 2,700 kWh a year.
- Mining is a race to guess numbers, and the network automatically makes the guessing harder whenever more machines join, so extra electricity never produces extra coins. It only changes who wins them.
- The reward halves roughly every four years, so the same electricity is now shared out among a quarter of the new coins it was in 2020. That is why the line steps up at each halving.
- Miners keep adding machines for as long as the coins they win are worth more than the power they burn, so the electricity bill climbs to meet whatever the coins fetch, and better, more efficient chips simply invite more machines.
The electricity is not making the coin. It is guarding the ledger, and new coins are just how the guarding gets paid for. That is why efficiency never helps: every improvement in the machines is met by more machines, until the power bill again eats most of the reward. Since 2010 the network has burned roughly 1,000 terawatt hours, near enough three years of Britain’s entire electricity demand.