MacroSnaps10 November 2026
No. 122Americans now hold 43% of their financial wealth in shares and funds, a record. At the dot-com peak it was 33%. British households hold 19%.
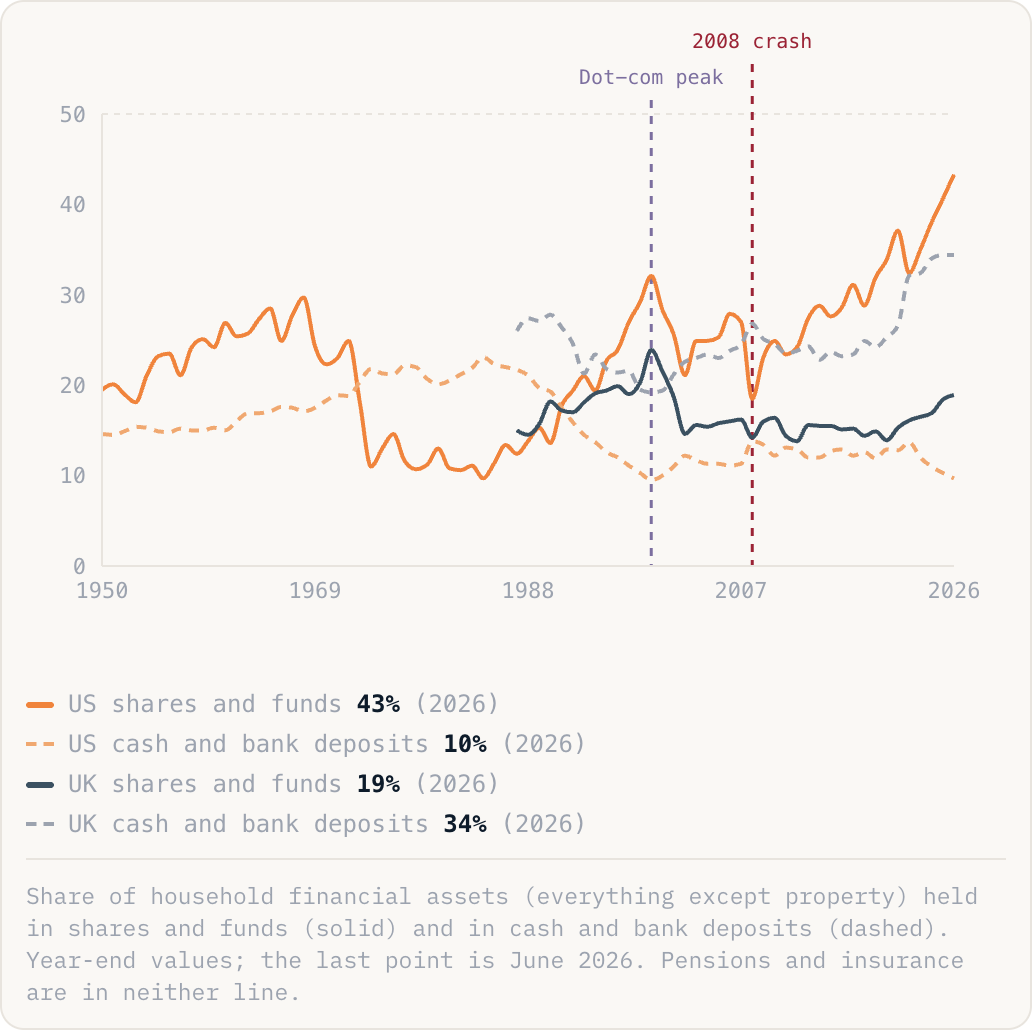
US shares and funds43%(2026)US cash and bank deposits10%(2026)UK shares and funds19%(2026)UK cash and bank deposits34%(2026)
Share of household financial assets (everything except property) held in shares and funds (solid) and in cash and bank deposits (dashed). Year-end values; the last point is June 2026. Pensions and insurance are in neither line.
Why this is happening
- Shares kept rising. Since 2009 American households' shares and funds have grown from $11.5tn to $66.5tn, nearly six times over. Their cash and bank deposits little more than doubled. The faster-growing holding takes a bigger slice.
- Cash paid almost nothing. For long stretches of 2009 to 2022 the Federal Reserve held interest rates near zero, so a bank balance earned next to nothing while shares climbed. Cash is back near its 2000 low of 9%.
- Britain is different. British households keep 34% in cash and bank deposits, more than three times America's share, and 44% in pensions and insurance. Their share in shares and funds has stayed between 12% and 24% since 1987.
The take
Last week's Nasdaq selloff (down 6.4% on 5 November, about $2.3tn gone, and 15% below its October record) falls on more American savings than the dot-com crash did. A 10% drop in shares and funds now takes about 4% off household financial wealth, against 3% then and 2% in Britain. Add the shares inside 401(k) pensions and insurance funds, and the Fed puts the American share at 48%.