Chinese households spend about 40 cents of every dollar their economy produces. American households spend 68.
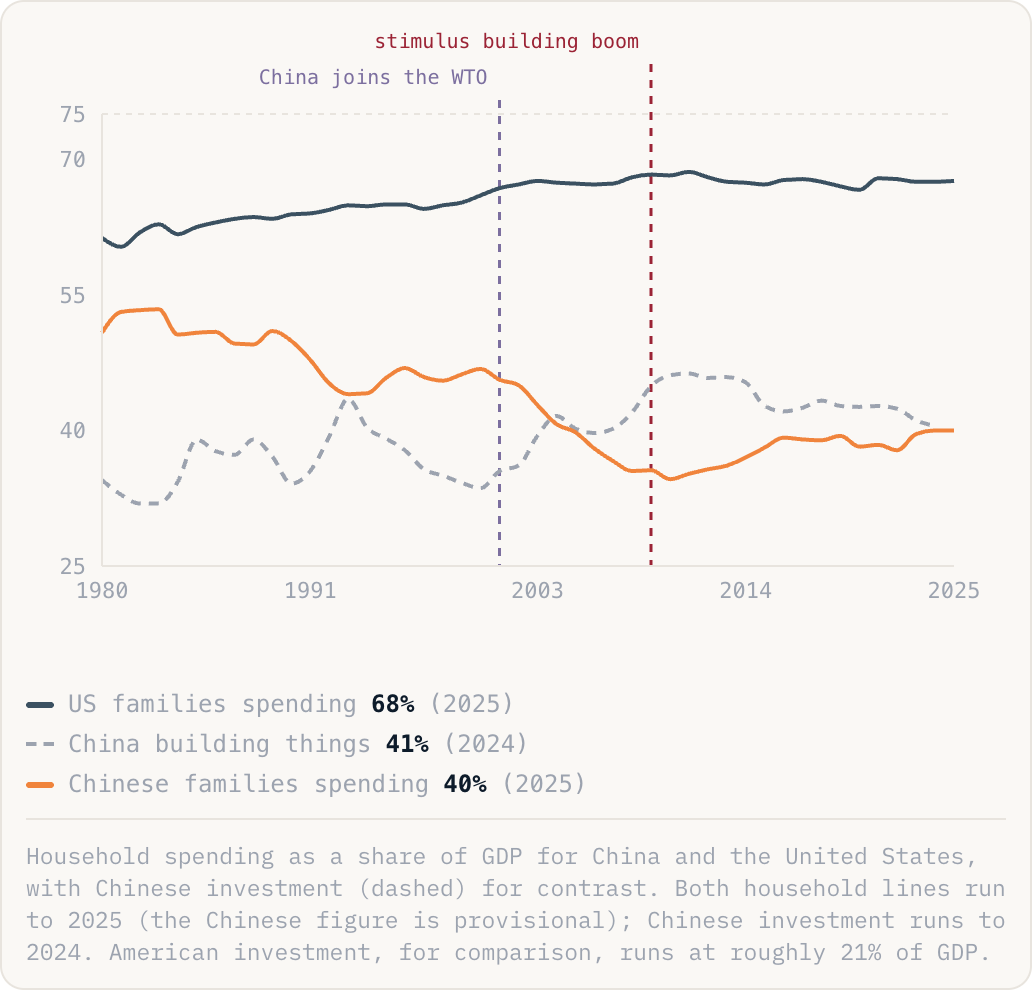
Household spending as a share of GDP for China and the United States, with Chinese investment (dashed) for contrast. Both household lines run to 2025 (the Chinese figure is provisional); Chinese investment runs to 2024. American investment, for comparison, runs at roughly 21% of GDP.
- Chinese households save hard because they have to. Healthcare, education and old age are largely self-funded, the state pension is thin, and until recently most family wealth sat in property, so families hold a large precautionary buffer.
- The system is built to move money from households to producers: bank deposits pay very little, land is allocated cheaply to industry, and local governments are rewarded for output and investment rather than for household income.
- An economy that produces far more than its own people buy has to sell the difference abroad, so the surplus becomes exports. The mirror image is a country whose people buy more than it produces: America, which fills the gap with imports.
These are not two independent policy choices, they are two halves of one arrangement. China's surplus savings have to go somewhere, and for 25 years they went into American assets, which held US interest rates down and helped fund the American consumer buying the Chinese goods. Every tariff argument is really an argument about this loop, and it cannot be settled by tariffs alone, because the cause sits in Chinese household balance sheets rather than at the border.