MacroSnaps13 September 2026
No. 64China made more cement in three years than America made in the whole of the 20th century.
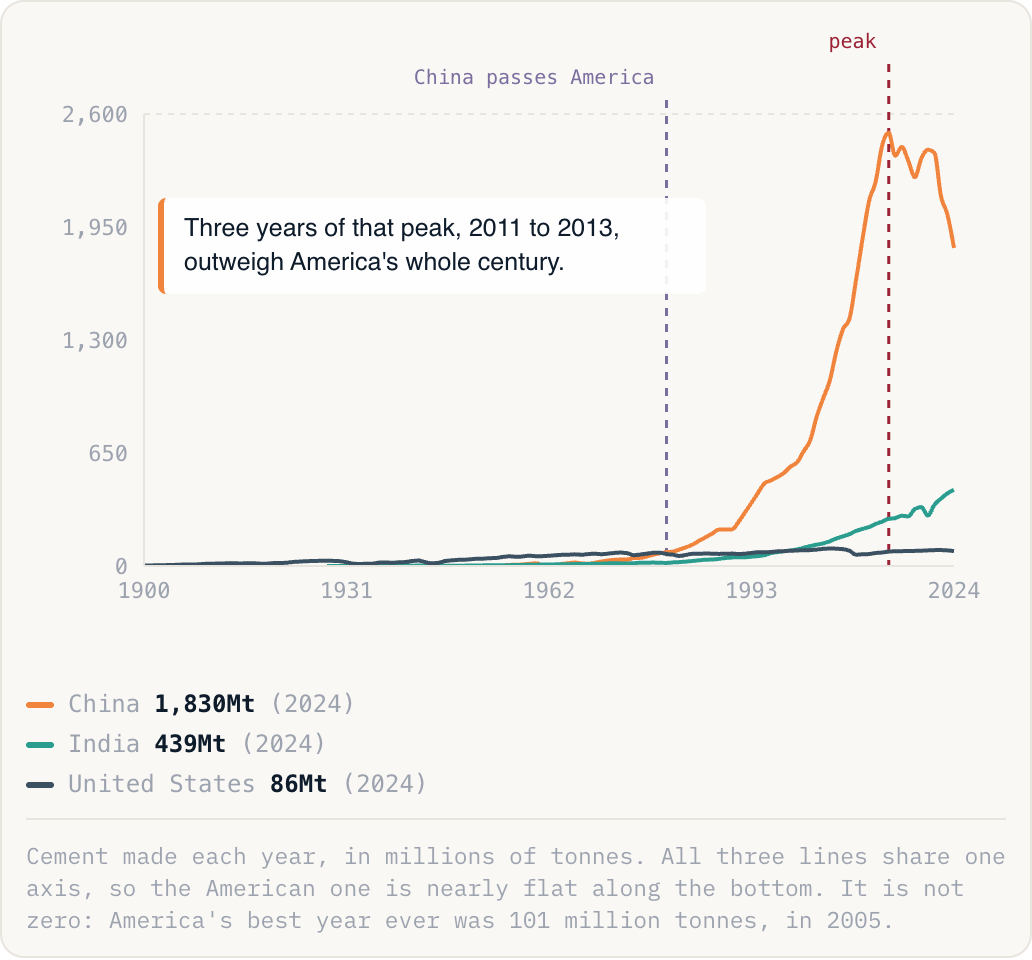
Three years of that peak, 2011 to 2013, outweigh America's whole century.
China1,830Mt(2024)India439Mt(2024)United States86Mt(2024)
Cement made each year, in millions of tonnes. All three lines share one axis, so the American one is nearly flat along the bottom. It is not zero: America's best year ever was 101 million tonnes, in 2005.
Why this is happening
- China moved hundreds of millions of people into cities in a single generation. It had to build the housing, roads, rail and bridges for all of them at once, rather than over a century as America did.
- Local governments raised money by selling land for development, so building was how they funded themselves. That turned construction into the engine of growth and kept the kilns running well past the point of need.
- Cement is heavy, cheap and goes off within months, so it is made close to where it is poured. Almost none of this crossed a border, which is why one country could dominate world output so completely.
The take
This is the largest physical construction project in human history, and it is over. Output has fallen a quarter from the 2014 peak and the biggest developers who drove it have gone bust. The buildings stay, but the demand for steel, copper, iron ore and coal that came with pouring them does not, and that is the shock still working through the world economy.
Source: Robbie Andrew, Global CO2 emissions from cement production, GCP-CEM (2025)