MacroSnaps14 September 2026
No. 65The richest 1% of Americans take a fifth of all income, the same share as in 1913. In Britain, France, Germany and Canada the richest 1% take an eighth.
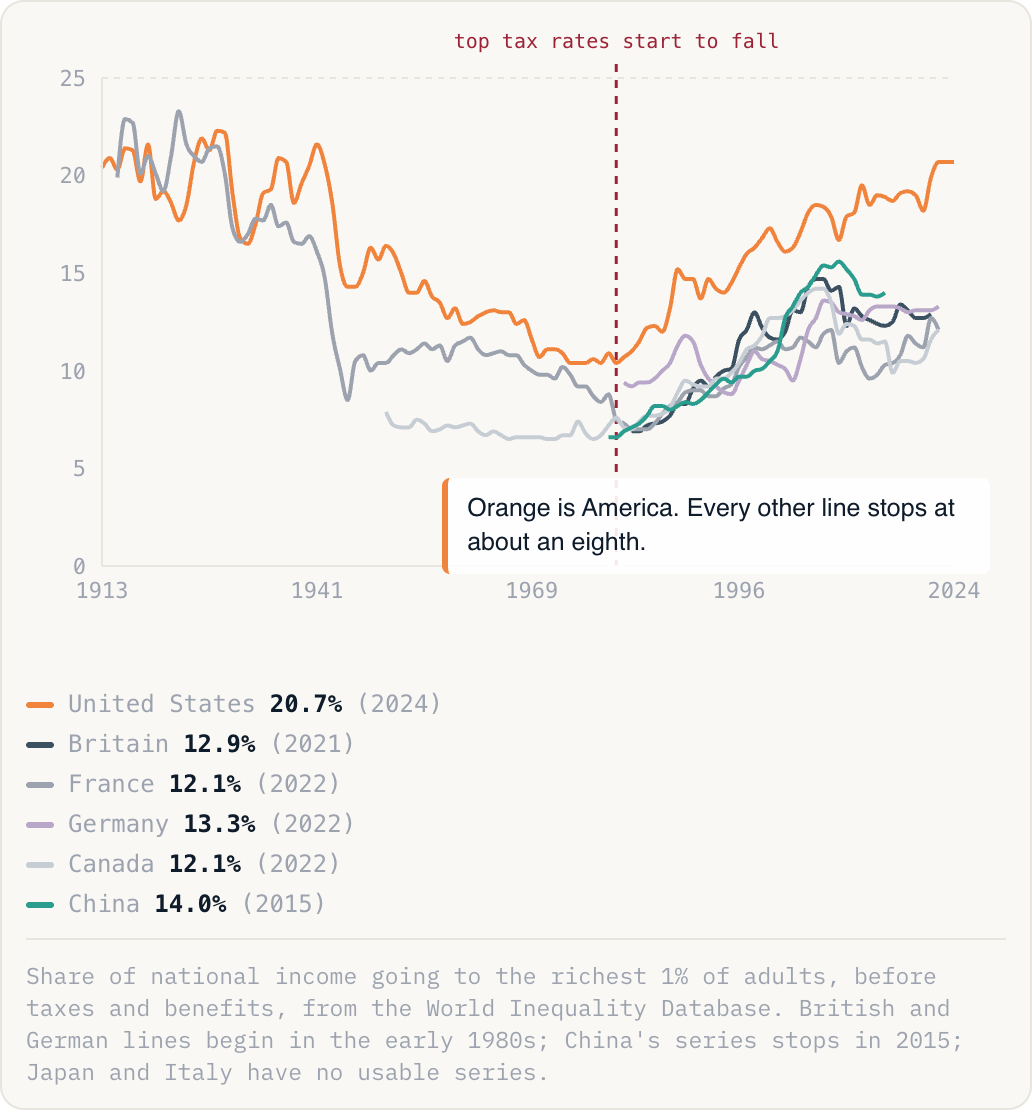
Orange is America. Every other line stops at about an eighth.
United States20.7%(2024)Britain12.9%(2021)France12.1%(2022)Germany13.3%(2022)Canada12.1%(2022)China14.0%(2015)
Share of national income going to the richest 1% of adults, before taxes and benefits, from the World Inequality Database. British and German lines begin in the early 1980s; China's series stops in 2015; Japan and Italy have no usable series.
Why this is happening
- In 1913 the richest 1% took a fifth in America and in France alike. Two world wars, the Depression and top tax rates above 90% cut that to a tenth by the 1970s, in every country the data reaches.
- After 1980 the share rose everywhere, but only America's kept climbing, from 10% to 21%. Pay at the top exploded, in finance and the boardroom, and the top federal tax rate fell from 70% to 28% by 1988, which made huge pay worth fighting for.
- Britain cut its top rate from 83% to 40% in the same decade and its 1% doubled too, from 7% to 13%, then stopped. France, Germany and Canada flattened at about 12% after 2000. China's 1% rose from 7% in 1980 to 14% by 2015, the European level.
The take
Taxes and benefits narrow every gap but change no ranking: after them America's richest 1% still take 15% of income, Germany's 10%, Britain's and Canada's 9%, France's 7%. What changed after 1980 was not the size of the pie but who takes it: a slice that went to the rest of the country in the 1970s now goes to the top hundredth, and America's share is back to 1913.