MacroSnaps26 September 2026
No. 77For most of the past decade, English second-tier football clubs have paid out more in wages than they earned in revenue.
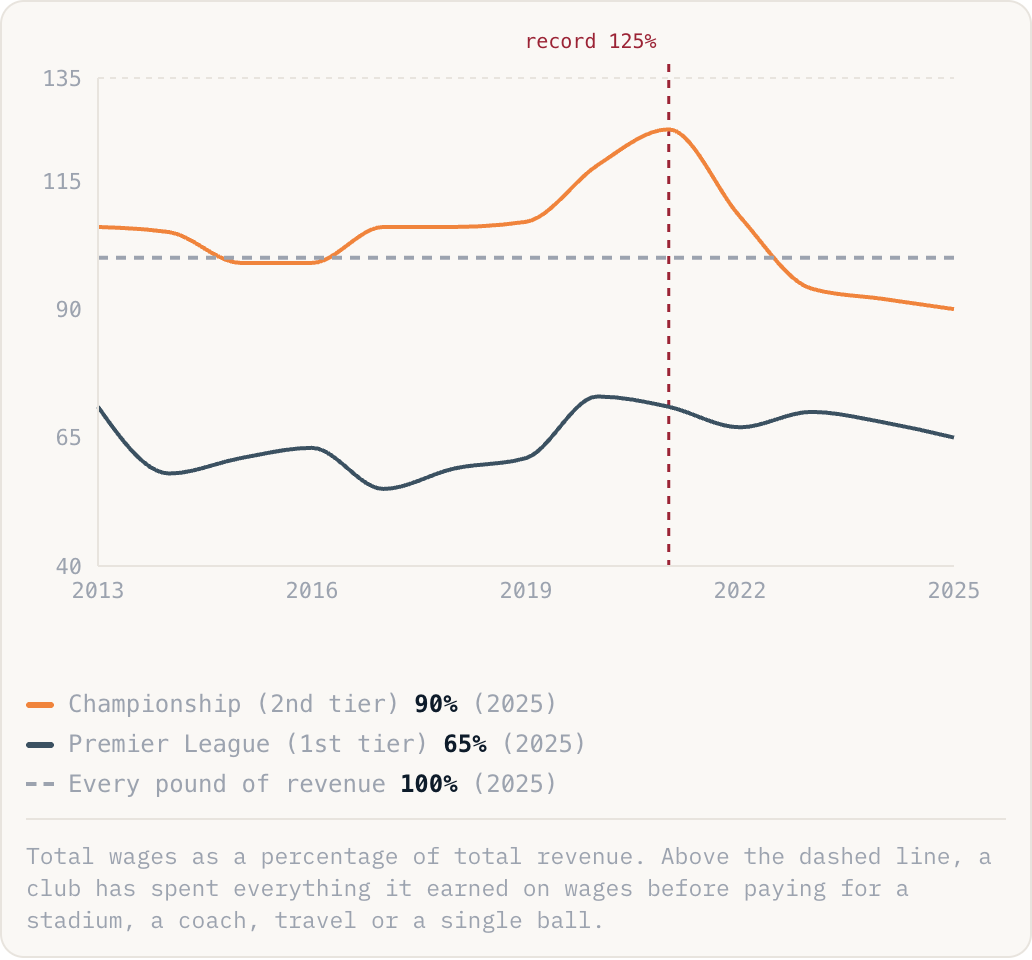
Championship (2nd tier)90%(2025)Premier League (1st tier)65%(2025)Every pound of revenue100%(2025)
Total wages as a percentage of total revenue. Above the dashed line, a club has spent everything it earned on wages before paying for a stadium, a coach, travel or a single ball.
Why this is happening
- The prize for winning is enormous and the prize for finishing second is nothing. Promotion to the Premier League is worth well over £100m across three years once parachute payments are counted, so spending £20m more on wages is a rational gamble even at long odds.
- Because every club can do that arithmetic, they all spend, and only three of 24 go up. The money is competed away and the losses stay behind, which is why the division as a whole loses money almost every year.
- Relegated clubs make it worse. They arrive with Premier League contracts and parachute payments, so they can outspend everyone, and the rest have to match them or accept they cannot compete.
The take
This is a textbook tournament: a prize so large relative to the field that rational competitors will collectively spend more than the prize is worth. It is the same shape as an arms race, a bidding war for a takeover, or the money poured into winning a single government contract. The football version is unusual only because the accounts are published, so you can watch an entire industry destroy value in public, year after year, and keep doing it.
Source: Deloitte Annual Review of Football Finance (2026)