MacroSnaps28 October 2026
No. 109For 25 years, about 130,000 people a day climbed out of extreme poverty. Around 2015 it slowed to a crawl.
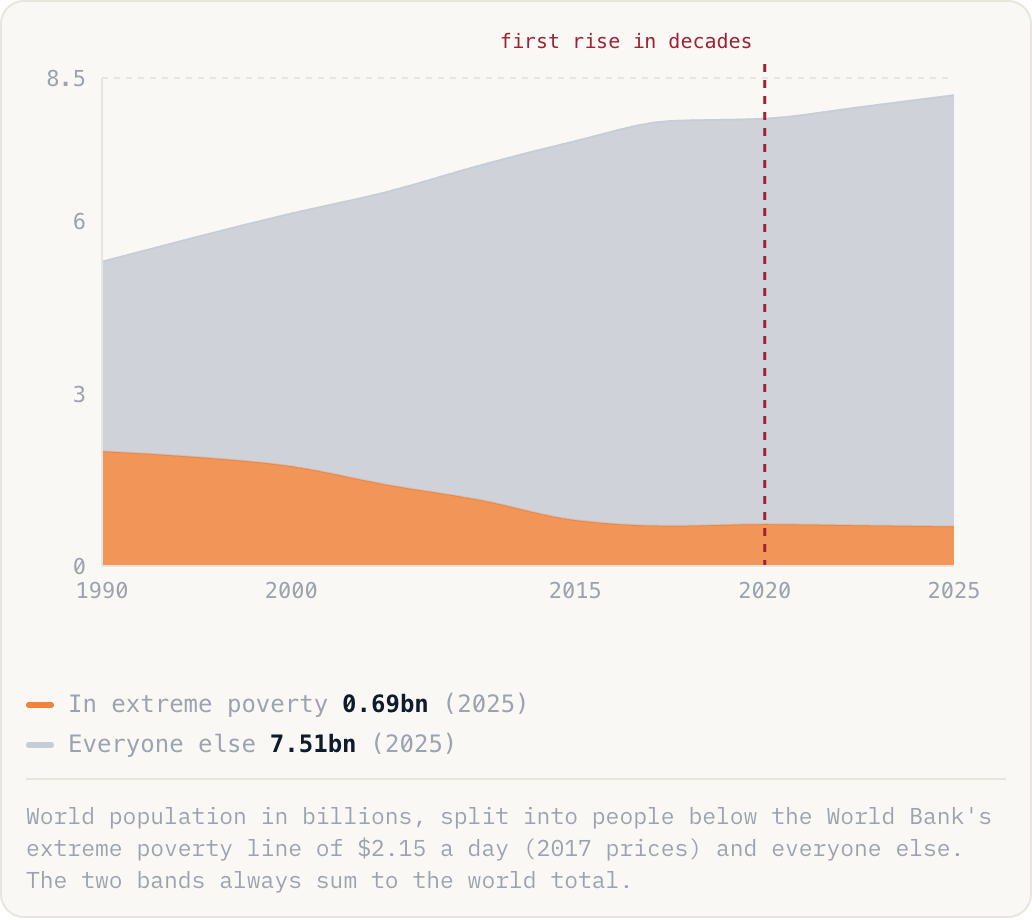
In extreme poverty0.69bn(2025)Everyone else7.51bn(2025)
World population in billions, split into people below the World Bank's extreme poverty line of $2.15 a day (2017 prices) and everyone else. The two bands always sum to the world total.
Why this is happening
- Growth in Asia did most of it. China moved roughly 800 million people above the line in a generation, and India, Indonesia, Vietnam and Bangladesh followed the same route: factories, cities, and farms that finally produced a surplus.
- The slowdown is not a mystery. Poverty is now concentrated in sub-Saharan Africa and in fragile states, where growth is slow, populations are growing fast and conflict undoes progress. About two thirds of the world's extreme poor now live in countries at war or close to it.
- The pandemic, then food and energy price spikes, then a debt squeeze on poor governments, took out most of a decade. Half the world's low-income countries are now in debt distress or close to it, which limits what their governments can spend on getting people over the line.
The take
The greatest reduction in human misery ever recorded happened inside most readers' lifetimes, and almost nobody noticed, because it never happened on a single day. What should worry us is the flattening: the easy gains, in big fast-growing Asian countries, have been taken. What is left is the hard part, and nothing in the current trend suggests it gets done.