MacroSnaps29 October 2026
No. 110A dollar kept as cash since 1971 has lost most of its value. The same dollar held in gold has multiplied many times over.
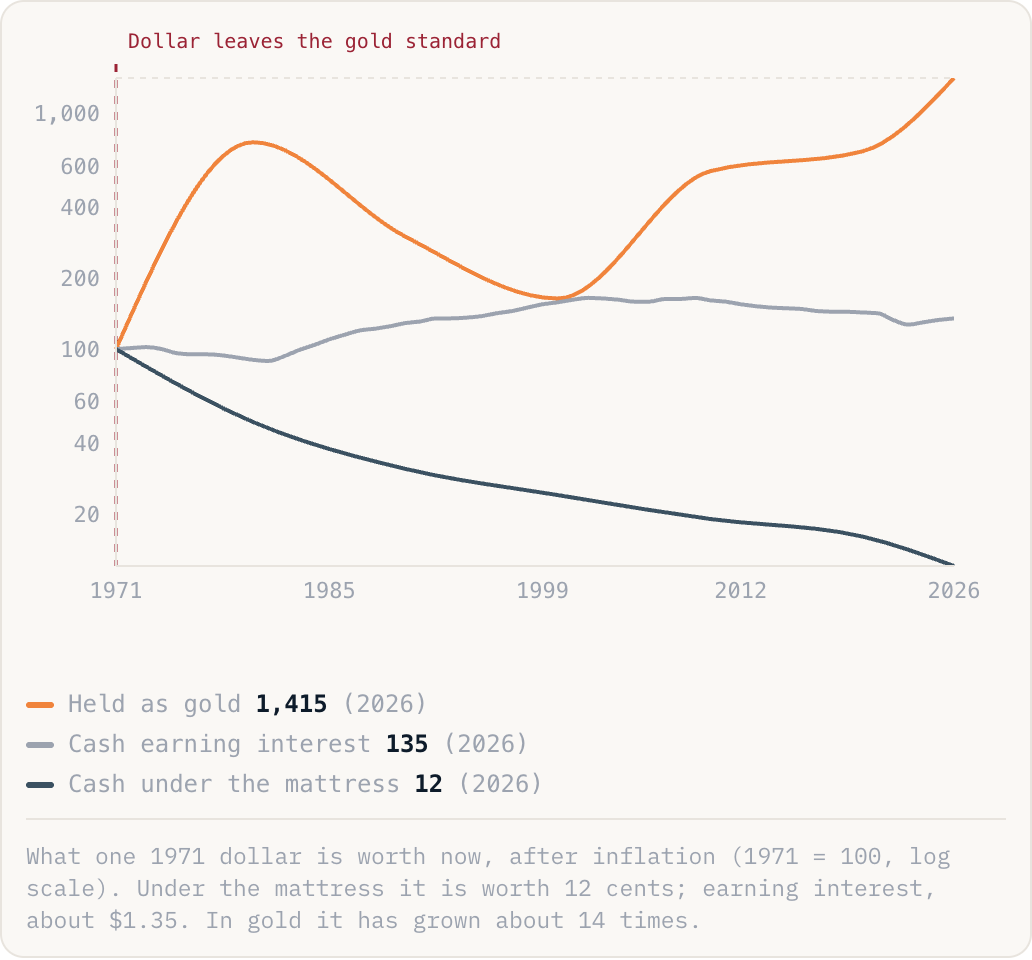
Held as gold1,415(2026)Cash earning interest135(2026)Cash under the mattress12(2026)
What one 1971 dollar is worth now, after inflation (1971 = 100, log scale). Under the mattress it is worth 12 cents; earning interest, about $1.35. In gold it has grown about 14 times.
Why this is happening
- Gold cannot be printed, so its supply grows only slowly while paper money can be created at will. Since 1971 the dollar has been backed by nothing but trust, and it has steadily bought less.
- That fixed scarcity is why, over long stretches, gold has held its footing against everyday goods, even as the cash price of everything climbed.
- But gold pays no interest and swings violently: it lost most of its real value between 1980 and 2000 before roaring back. The long-run protection comes with a stomach-churning ride.
The take
Gold is no one's idea of a calm, compounding investment; it earns nothing and lurches around for decades. But it cannot be printed, and that scarcity has guarded the purchasing power that cash quietly gives away. An ounce bought a fine toga in Rome and still buys a good suit today. Judge gold as insurance against currencies, not as a smooth way to grow richer.