MacroSnaps11 October 2026
No. 92Norway sold 96% of its new cars as electric last year. The oil and gas it pumps for the world puts about ten times more CO2 into the air than the whole of Norway does.
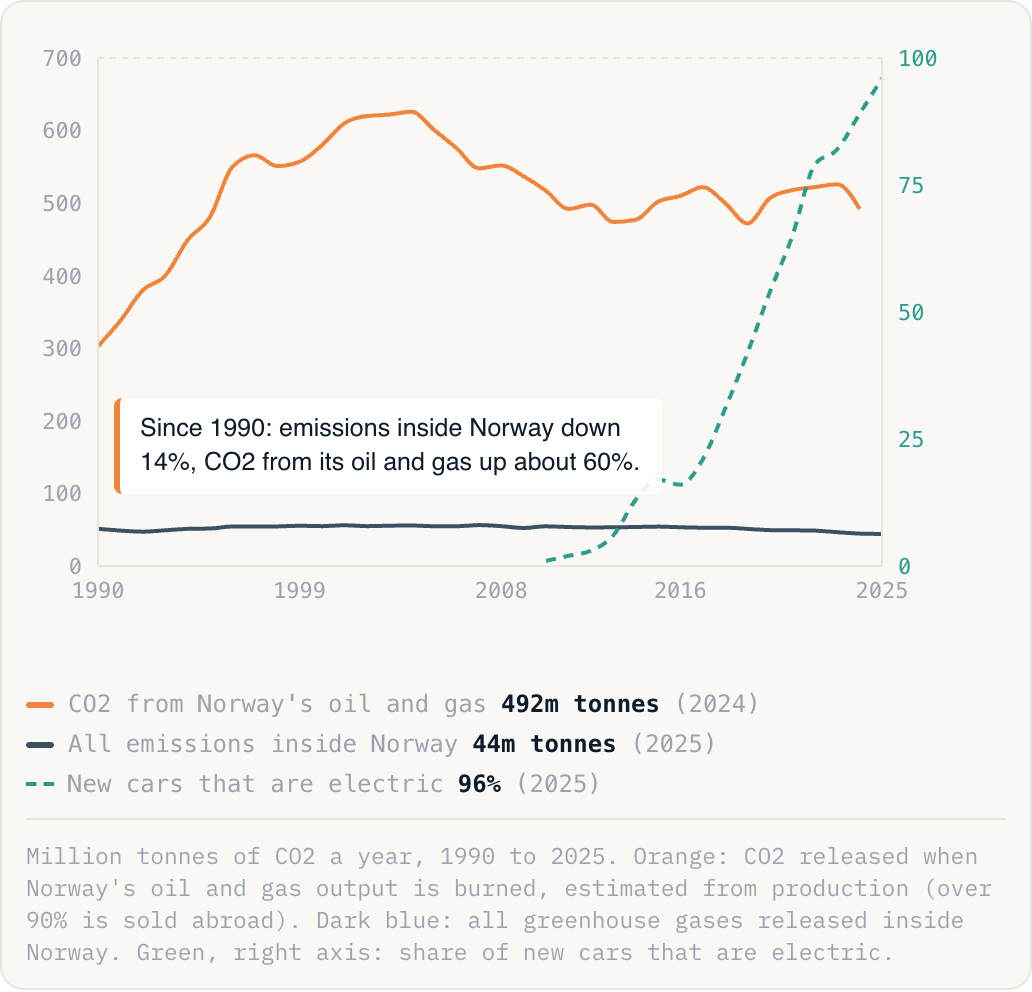
Since 1990: emissions inside Norway down 14%, CO2 from its oil and gas up about 60%.
CO2 from Norway's oil and gas492m tonnes(2024)All emissions inside Norway44m tonnes(2025)New cars that are electric96%(2025)
Million tonnes of CO2 a year, 1990 to 2025. Orange: CO2 released when Norway's oil and gas output is burned, estimated from production (over 90% is sold abroad). Dark blue: all greenhouse gases released inside Norway. Green, right axis: share of new cars that are electric.
Why this is happening
- Whose CO2 is it? Climate rules count emissions where fuel is burned, not where it is dug up. Norwegian gas burned in a German power station counts as German CO2.
- What the oil pays for. Oil and gas are 57% of Norway's goods exports, worth about NOK 1 trillion ($95bn) in 2025. The profits go into its NOK 21 trillion fund, which covers about a fifth of the state budget.
- Is it winding down? Not yet. Norway awards dozens of new drilling licences every year and expects output to stay near its highs until about 2030.
The take
Countries are graded on the CO2 released inside their borders. On that score Norway looks like a model: hydro power, electric cars, falling emissions. Count the fuel it sells and it is Europe's biggest gas supplier, and that money helps pay for the model. When Norway is held up as a climate leader, it is worth asking which of these two numbers is being used.