MacroSnaps4 October 2026
No. 85The G7 is releasing 100 million barrels of oil and diesel from its emergency stockpiles. That sounds huge, but it is only three days of what G7 countries use. It still knocked 9% off the price of diesel in two days.
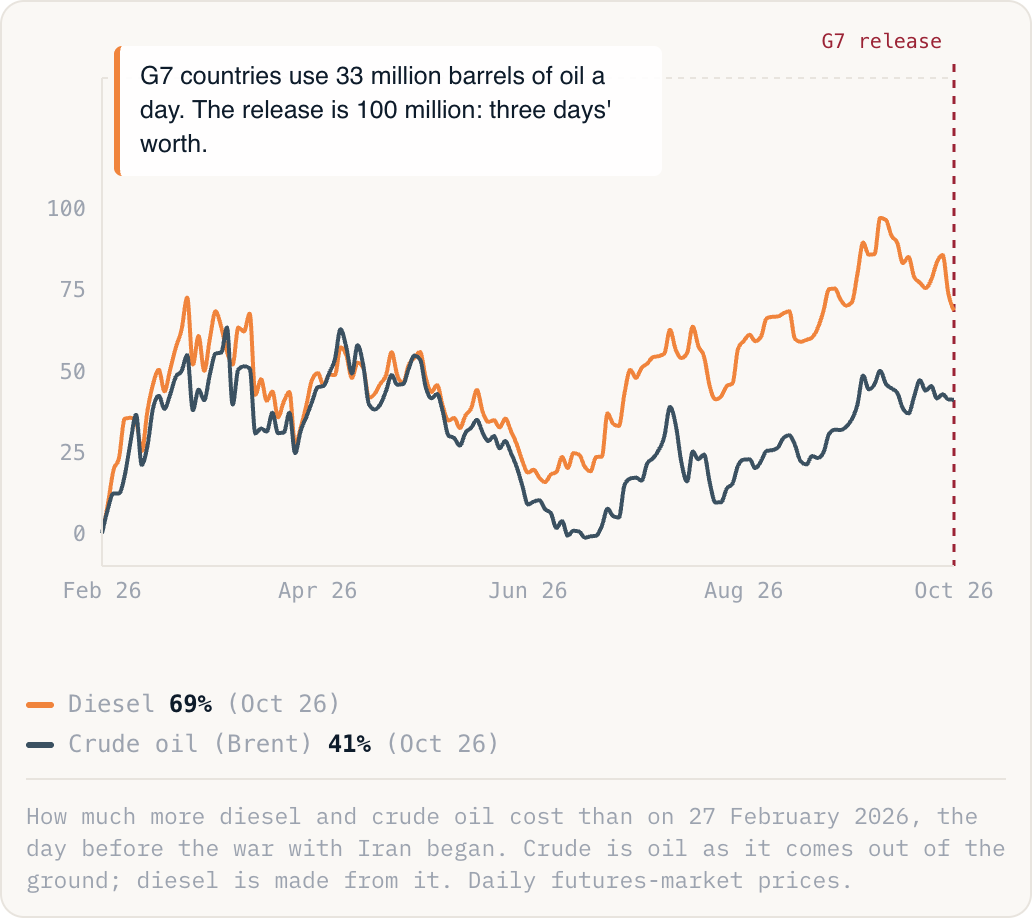
G7 countries use 33 million barrels of oil a day. The release is 100 million: three days' worth.
Diesel69%(Oct 26)Crude oil (Brent)41%(Oct 26)
How much more diesel and crude oil cost than on 27 February 2026, the day before the war with Iran began. Crude is oil as it comes out of the ground; diesel is made from it. Daily futures-market prices.
Why this is happening
- What is being released. Governments keep stockpiles of oil and fuel for emergencies. The G7 (the US, Japan, Germany, the UK, France, Italy and Canada) will sell 100 million barrels from theirs over four months.
- Why it is small. Spread over four months, it adds about 2.5% to the oil G7 countries use each day. That can calm prices for a while. It cannot replace the oil the war has cut off.
- Why diesel fell more than crude. Crude oil is the raw oil pumped out of the ground. A refinery turns it into fuels such as diesel and petrol. Tankers of crude are getting through the Gulf again, but there is too little diesel: Gulf refineries are making less, Ukraine is bombing Russia's and China has stopped selling diesel abroad. So diesel is up 69% since the war began, crude 41%, and the G7 is releasing diesel first.
The take
Diesel fuels lorries, tractors and farm machinery, so a high diesel price ends up in the price of food. The G7 also promised not to block fuel sales to each other. That matters because Trump had threatened to stop selling American diesel abroad, which would have pushed Europe's prices higher still. Even after this week's fall, diesel costs 69% more than before the war.