MacroSnaps5 November 2026
No. 117China sold the world $1.19 trillion more than it bought last year. No country has ever run a trade surplus that big: the next biggest, Russia's in 2022, was about a quarter of the size.
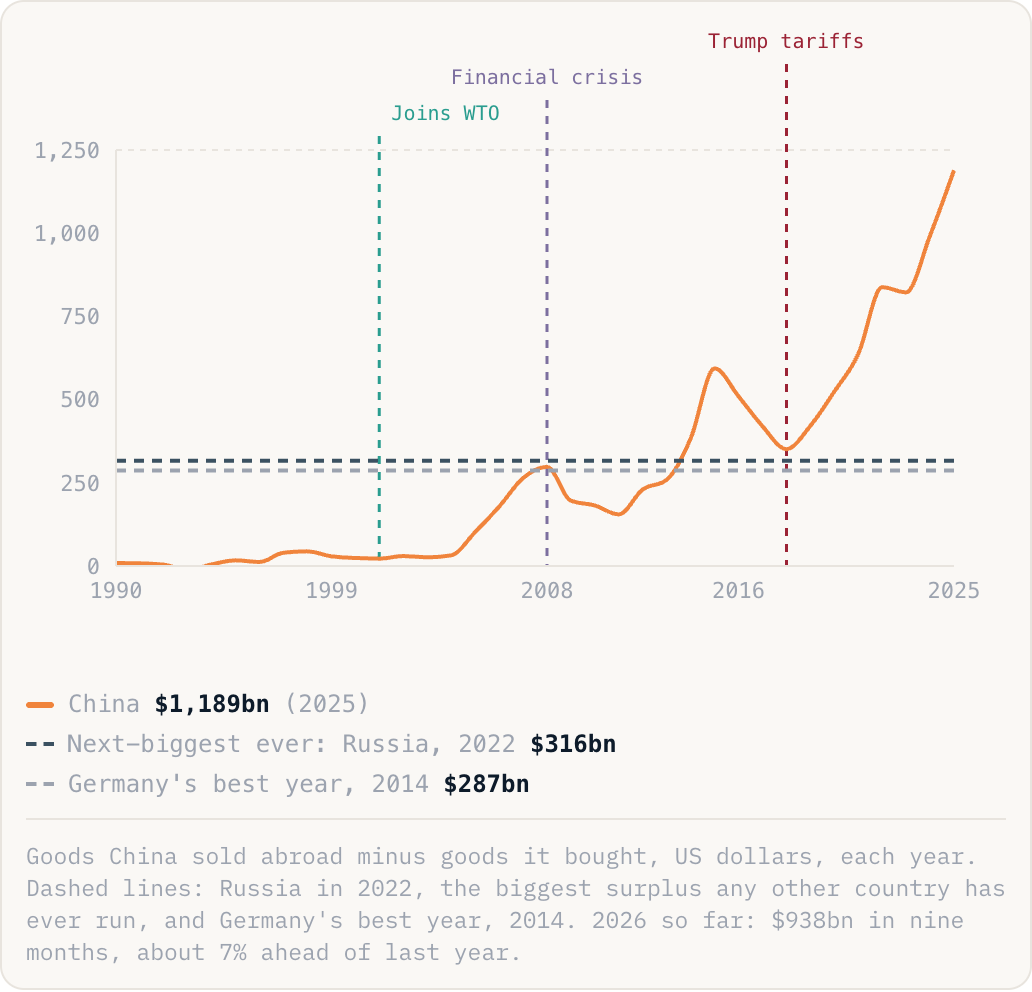
China$1,189bn(2025)Next-biggest ever: Russia, 2022$316bnGermany's best year, 2014$287bn
Goods China sold abroad minus goods it bought, US dollars, each year. Dashed lines: Russia in 2022, the biggest surplus any other country has ever run, and Germany's best year, 2014. 2026 so far: $938bn in nine months, about 7% ahead of last year.
Why this is happening
- China makes far more than its own people buy. Chinese households spend about 40% of what the country earns; in America it is 68%. So factories making cars, solar panels, steel and chips sell the rest abroad.
- It buys raw materials and sells finished goods. In 2025 China sold $2.05 trillion more manufactured goods than it bought, and spent $859bn more on oil, ore and food than it sold. It ran a surplus with 196 of its 249 trading partners.
- Tariffs moved the surplus; they did not shrink it. In 2018 almost all of it was with America. Now China's surplus with the European Union ($292bn) is bigger than with America ($280bn), and South-East Asia ($276bn) is close behind.
The take
For shoppers in Europe, Mexico and South-East Asia, this means cheaper cars, phones and solar panels. For factories there that make the same things, it means competition that has already shut some of them down, such as many of Europe's solar panel makers. That is why the EU taxes Chinese electric cars and Mexico put tariffs of up to 50% on Chinese cars this year. More countries are likely to follow for as long as Chinese families spend so little at home.