MacroSnaps30 September 2026
No. 81The richest tenth of Americans now account for close to half of all American spending.
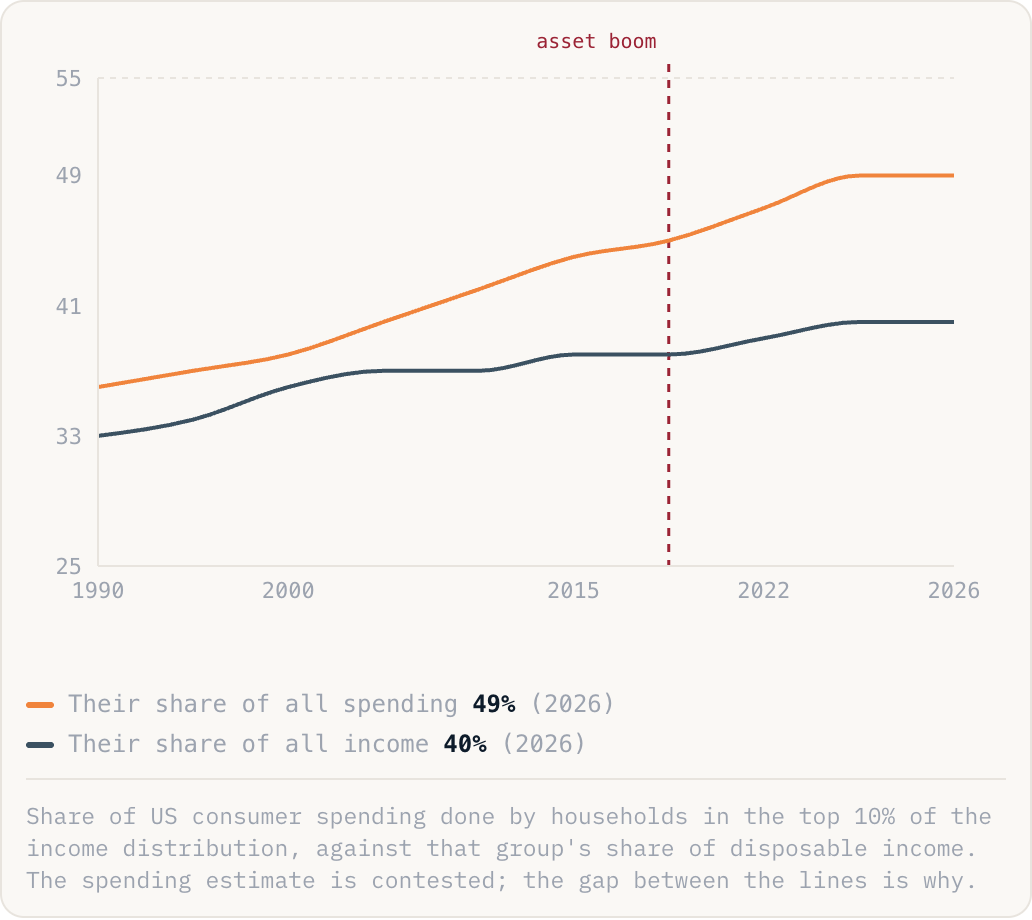
Their share of all spending49%(2026)Their share of all income40%(2026)
Share of US consumer spending done by households in the top 10% of the income distribution, against that group's share of disposable income. The spending estimate is contested; the gap between the lines is why.
Why this is happening
- When your assets go up you spend more, even if your salary has not changed. That is the wealth effect, and after a decade in which shares and houses rose far faster than wages, the people who own them have been spending out of gains rather than earnings.
- The rest is arithmetic. Households in the bottom 80% spend almost all of what they earn, so their spending can only grow as fast as their pay, which since 2020 has roughly kept pace with prices and no more.
- The figure is disputed and the dispute is instructive. Some economists argue the top tenth cannot be half of spending when they receive under 40% of income. The reply is that spending can exceed income when you are selling assets or borrowing against them, which is exactly what the top decile has been doing.
The take
An economy this dependent on its richest tenth is an economy leaning on the stock market. Their spending is funded by asset prices, so a serious market fall would cut consumption in a way that job numbers would not predict, and the standard recession models, built when spending tracked wages, would miss it. It also means strong aggregate consumption is no longer evidence that most people are doing well.