MacroSnaps7 November 2026
No. 119In about half the years since 1980, US shares fell 10% or more along the way. Two-thirds of those years still ended higher.
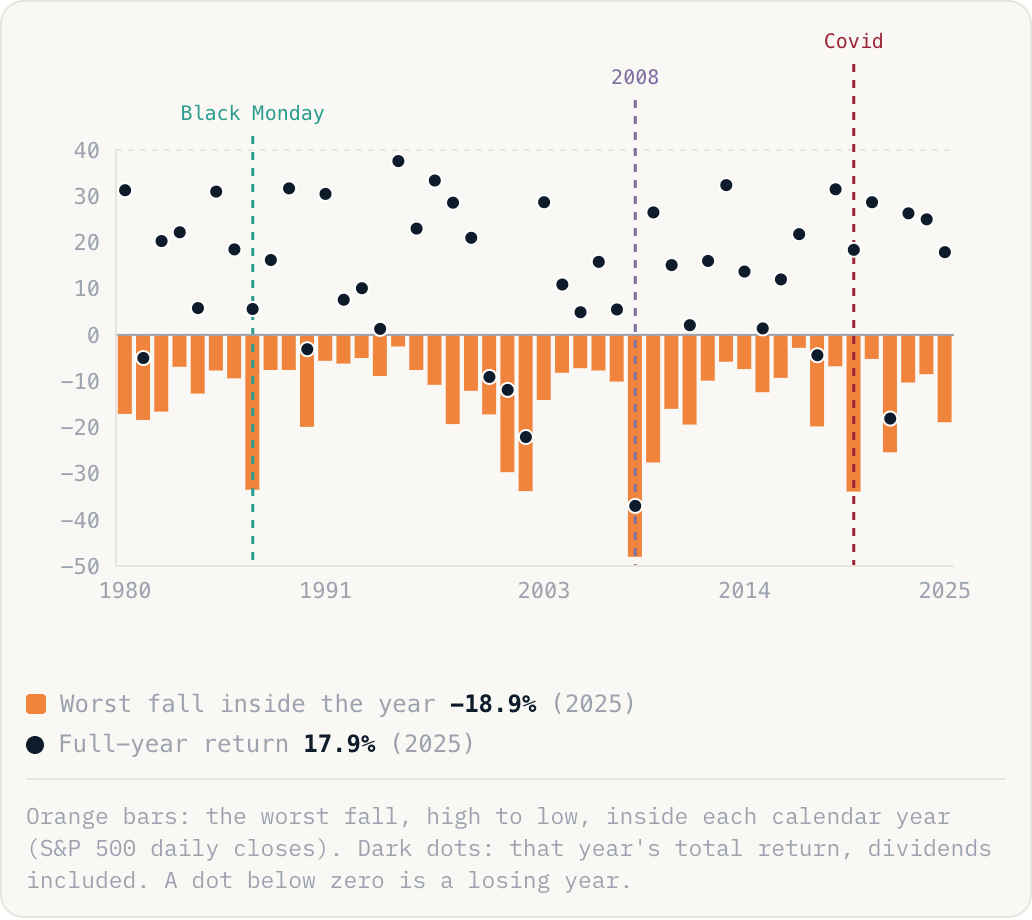
Worst fall inside the year-18.9%(2025)Full-year return17.9%(2025)
Orange bars: the worst fall, high to low, inside each calendar year (S&P 500 daily closes). Dark dots: that year's total return, dividends included. A dot below zero is a losing year.
Why this is happening
- Falls come with the territory. Share prices swing on news, fear and interest rates. The average year has a 14% drop somewhere in it, and only 1995 and 2017 never fell more than 3%.
- Most dips heal. Companies keep earning and buyers return. In 1987 shares lost a fifth in one day and the year still ended up. In 2020 they fell 34% in five weeks and finished 18% higher.
- Some dips do not. Eight years ended lower, including 2000, 2001, 2002, 2008 and 2022. Of the seven years with a fall beyond 20%, four finished down.
The take
A fall on its own cannot tell you which kind of year you are in. Two-thirds of the 10% falls ended in a gain and one third in a loss, and nothing on the day separates them. For anyone who owns shares, a 10% fall in roughly every second year is the normal cost, and in some years it was the start of real losses.