MacroSnaps21 September 2026
No. 72Japanese stocks took 34 years to climb back to their 1989 peak. In dollars it took 31.
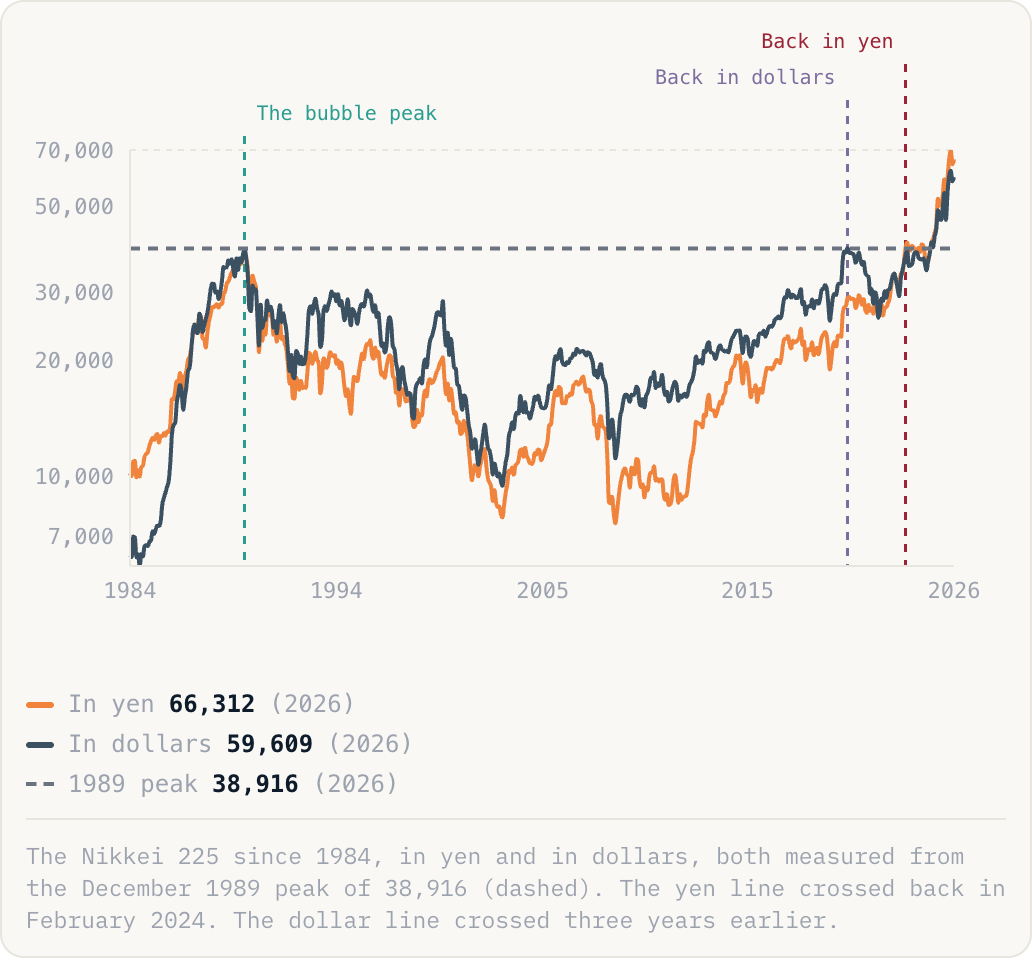
In yen66,312(2026)In dollars59,609(2026)1989 peak38,916(2026)
The Nikkei 225 since 1984, in yen and in dollars, both measured from the December 1989 peak of 38,916 (dashed). The yen line crossed back in February 2024. The dollar line crossed three years earlier.
Why this is happening
- By 1989 Japanese shares and land traded at valuations with no precedent, floated on cheap credit and the belief that prices could only rise. The index then fell 81% over the next 19 years.
- The dollar line broke even first because the yen was strong. In early 2012 a dollar bought 76 yen, so foreign owners were being paid back in a rising currency while the index itself was still on the floor.
- Since 2022 that has run in reverse. The yen has fallen to around 160, so the index is 70% above its 1989 peak in yen and 53% above it in dollars.
The take
Break even is not one date. It depends on the money you count in, and for a foreign owner the currency can be half the answer. Japan lost decades, and that is real. But the famous 34 year wait is a yen number. The same holding, in dollars, was whole three years sooner, then gave part of it back when the yen collapsed.
Source: FRED (Nikkei 225; USD/JPY)