MacroSnaps4 September 2026
No. 55The music industry just had its biggest year ever. Adjusted for inflation it is still a third smaller than in 1999.
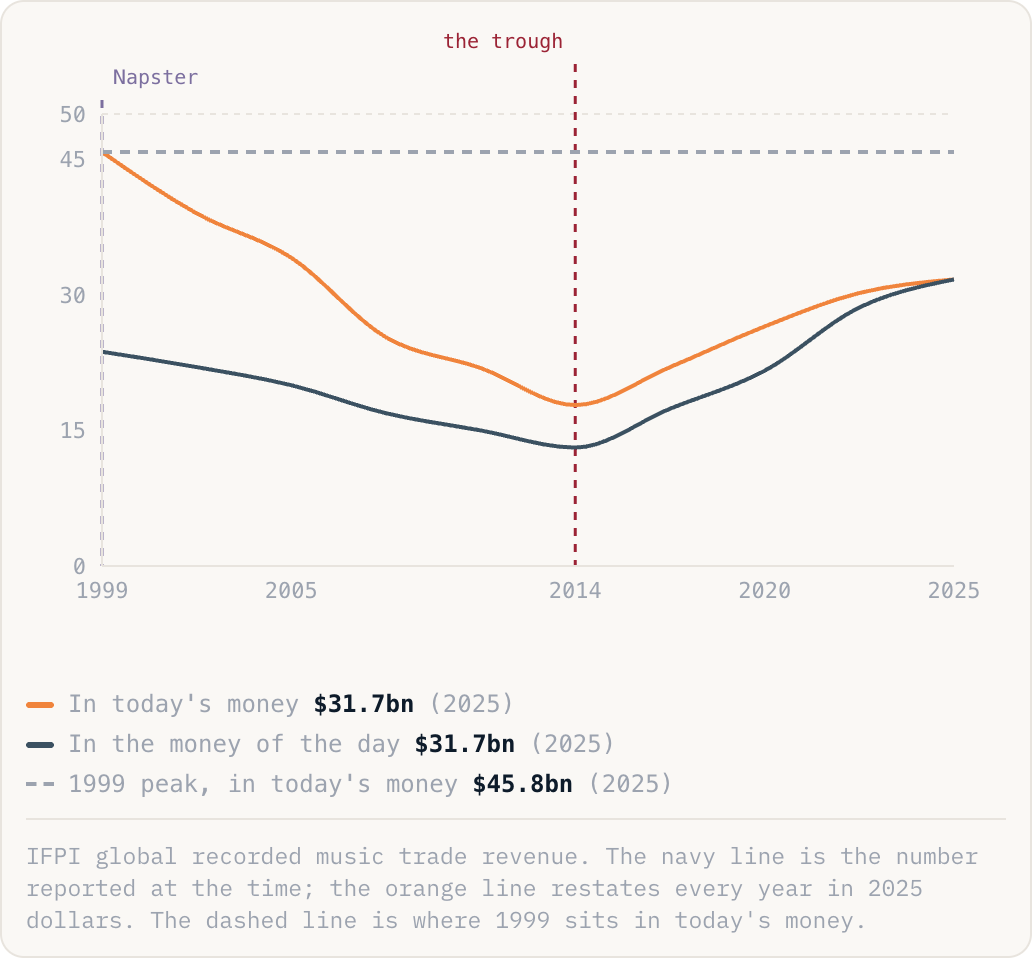
In today's money$31.7bn(2025)In the money of the day$31.7bn(2025)1999 peak, in today's money$45.8bn(2025)
IFPI global recorded music trade revenue. The navy line is the number reported at the time; the orange line restates every year in 2025 dollars. The dashed line is where 1999 sits in today's money.
Why this is happening
- Napster did not just enable copying, it broke the bundle. The industry sold $15 albums to people who wanted one song, and once that was no longer enforceable the revenue attached to the other eleven tracks never came back.
- Streaming rebuilt the business on a completely different model: rent instead of ownership. It works because a subscriber pays every month forever rather than once, but the ceiling is lower, because you cannot charge someone $15 a month twenty times a year.
- The recovery is also a change in who gets paid. Live music and publishing now carry far more of the industry's economics than they did in 1999, so recorded revenue alone understates how artists actually earn.
The take
This is the clearest case study anyone has of what a technology shock really costs. Not a dip and a bounce, but 15 years of decline, a floor at a third of the peak, and a recovery that after a quarter of a century has still not got back to where it started. Worth holding in mind whenever a current industry is told that a new technology will merely "disrupt" it.