MacroSnaps15 October 2026
No. 96Half of all American home loans still charge under 4% interest. A new one now costs 7.4%.
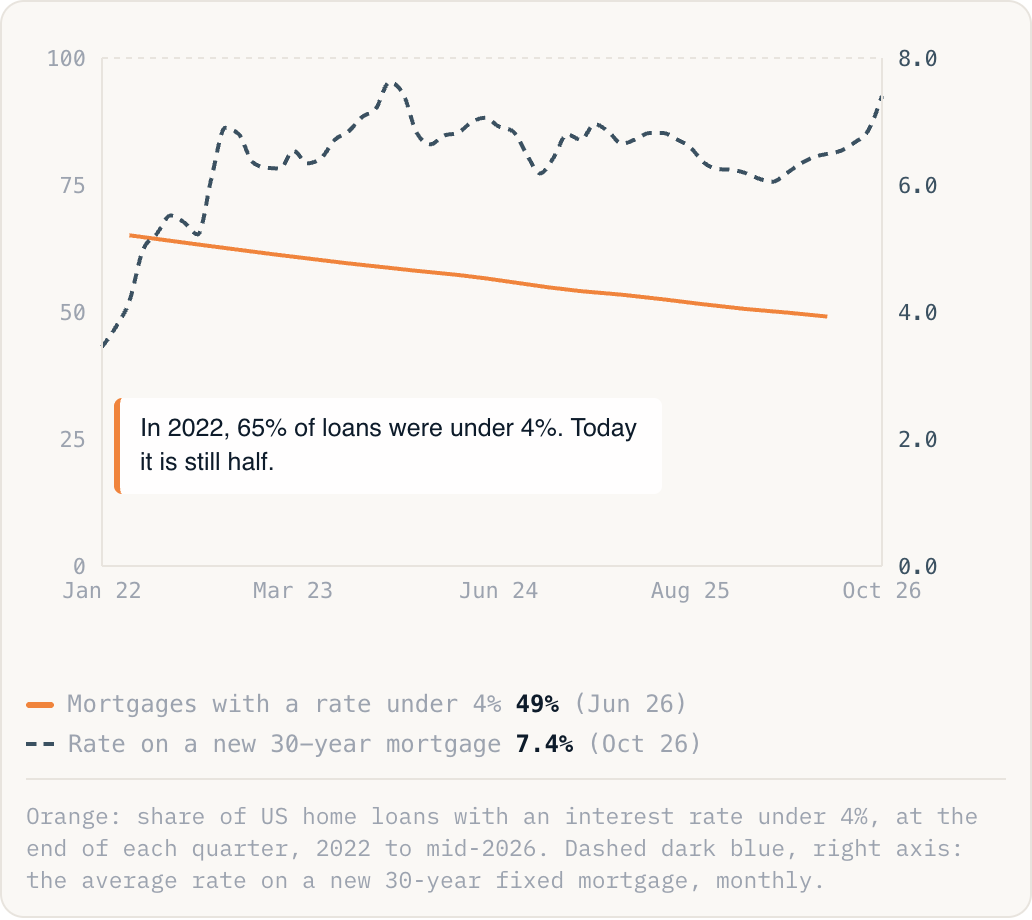
In 2022, 65% of loans were under 4%. Today it is still half.
Mortgages with a rate under 4%49%(Jun 26)Rate on a new 30-year mortgage7.4%(Oct 26)
Orange: share of US home loans with an interest rate under 4%, at the end of each quarter, 2022 to mid-2026. Dashed dark blue, right axis: the average rate on a new 30-year fixed mortgage, monthly.
Why this is happening
- How did so many get cheap loans? In 2020 and 2021 the rate on a 30-year mortgage fell to about 3%, and millions of households fixed it for 15 to 30 years.
- Why not just fade away? Selling means giving up that loan and borrowing again at 7.4%. Fewer owners move, so fewer homes come up for sale. A US housing regulator estimates it cut sales by owners with a mortgage by about a third this year.
- It is fading slowly. Loans over 6% are now 22.5% of the total, up from 7.3% in 2022, but cheap loans still number about 26 million.
The take
Half of homeowners are shielded from today's rates by loans they signed in 2020 to 2022. The cost falls on everyone else: first-time buyers, and anyone who has to move, who face 7.4%. It is a big reason so few homes are for sale, and why people stay put.
Source: FHFA National Mortgage Database; Freddie Mac Primary Mortgage Market Survey (2026)