MacroSnaps9 September 2026
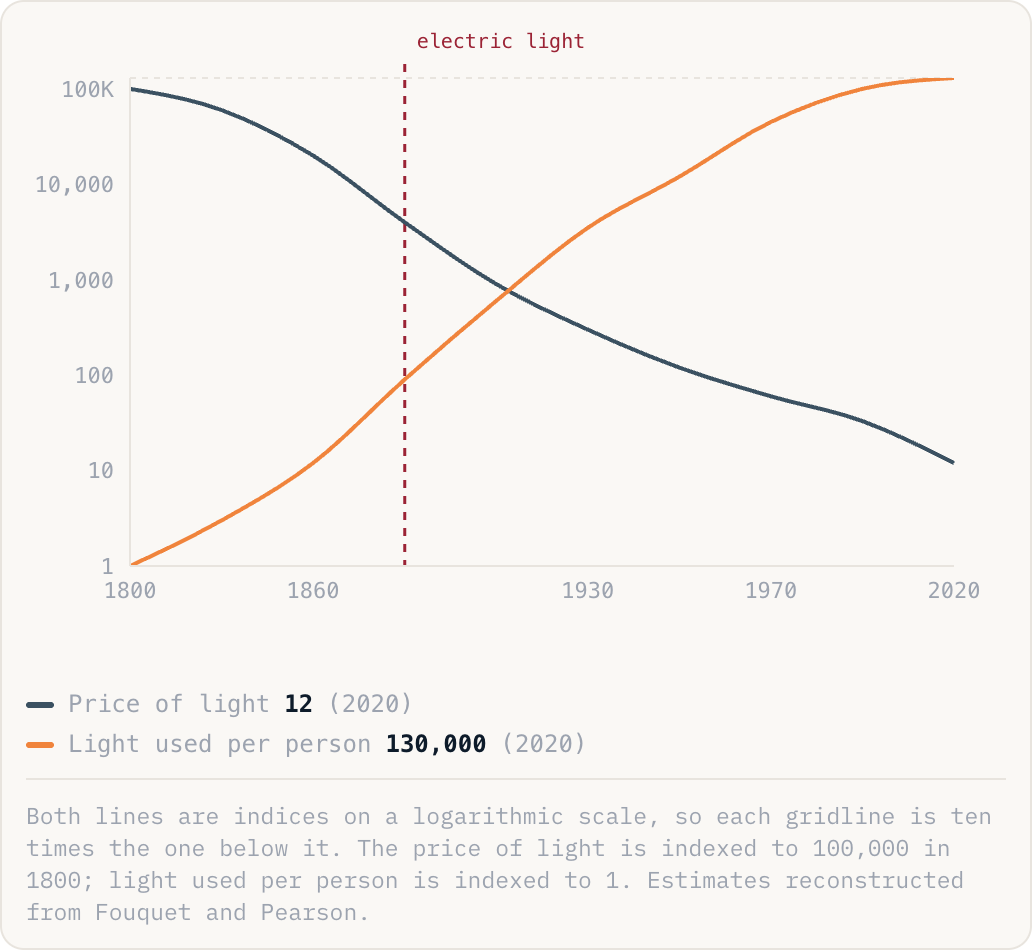
No. 60Light became about 3,000 times cheaper in Britain. Britons responded by using 100,000 times more of it.
Price of light12(2020)Light used per person130,000(2020)
Both lines are indices on a logarithmic scale, so each gridline is ten times the one below it. The price of light is indexed to 100,000 in 1800; light used per person is indexed to 1. Estimates reconstructed from Fouquet and Pearson.
Why this is happening
- Cheaper light did not mean people bought the same amount of light for less. It meant light became worth using in places nobody could previously justify: every room, all evening, streets, shop windows, offices, factories running night shifts.
- William Stanley Jevons noticed the same thing about coal in 1865: more efficient steam engines did not reduce Britain's coal use, they made coal-powered machinery worth installing in far more places, so total consumption rose.
- The effect is strongest when a resource is still expensive enough to ration. Once a use is fully satisfied, cheaper does not mean much more: doubling lighting efficiency today adds far less to demand than it did in 1900, because rooms are already as bright as anyone wants.
The take
Efficiency is not the same thing as less consumption, and treating them as identical is how energy forecasts go wrong. It matters right now for air conditioning, for electric cars and above all for computing: every previous jump in how cheaply we can compute has been met by a far bigger jump in how much computing we do.
Source: Fouquet and Pearson, Journal of Energy (2006); Nordhaus (1996)