MacroSnaps7 October 2026
No. 88India's economy is growing faster than any other big economy, but its stock market has lost 19% this year in dollars. South Korea's has gained 77%. Investors want companies that profit from AI, and India has almost none.
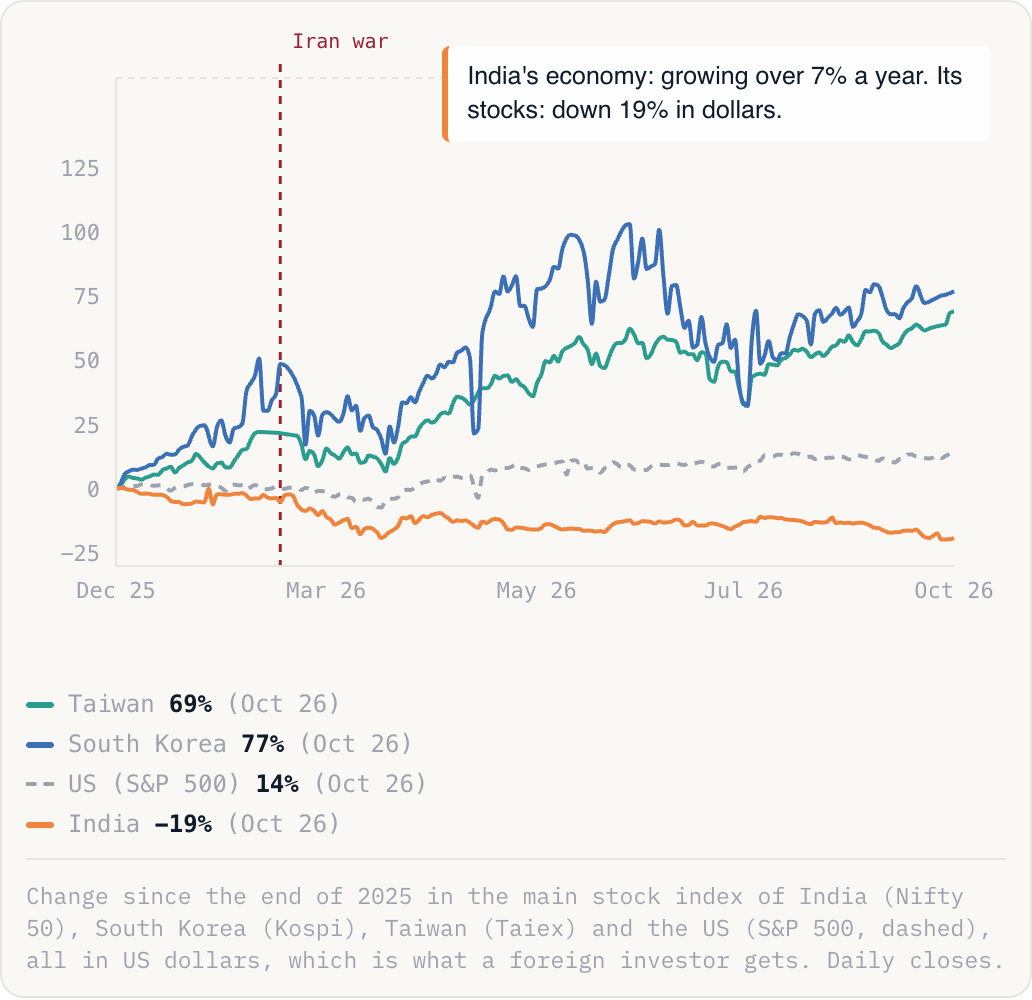
India's economy: growing over 7% a year. Its stocks: down 19% in dollars.
Taiwan69%(Oct 26)South Korea77%(Oct 26)US (S&P 500)14%(Oct 26)India-19%(Oct 26)
Change since the end of 2025 in the main stock index of India (Nifty 50), South Korea (Kospi), Taiwan (Taiex) and the US (S&P 500, dashed), all in US dollars, which is what a foreign investor gets. Daily closes.
Why this is happening
- No AI winners. Korea and Taiwan make the chips AI runs on, and their profits have soared. India's biggest listed companies are banks, oil refiners and IT outsourcers. And compared with their profits, Indian shares are still dearer than most rivals'.
- Oil. India buys over 90% of its oil abroad, and nearly half came through the Strait of Hormuz. Since the war with Iran, crude has mostly cost $90 to $100 a barrel, which pushes up inflation and squeezes company profits.
- Foreign money is leaving. US government bonds pay over 5%, near a 25-year high, and US shares are up 14% this year. The rupee has lost 7% against the dollar, so foreigners in Indian shares are down 19%. They have pulled out $40bn in two years.
The take
This hurts ordinary Indians, not just foreign funds. 150 million Indians now own shares or mutual funds, three times as many as a decade ago, and their monthly savings are what has stopped a bigger fall. Counted in rupees, they have lost 13% this year, in a weak job market with high inflation. If they stop buying, nothing else is holding the market up.