MacroSnaps31 October 2026
No. 112Two in three young households in England owned their home in 1991. By 2013 it was just over one in three. Now it is back to almost half.
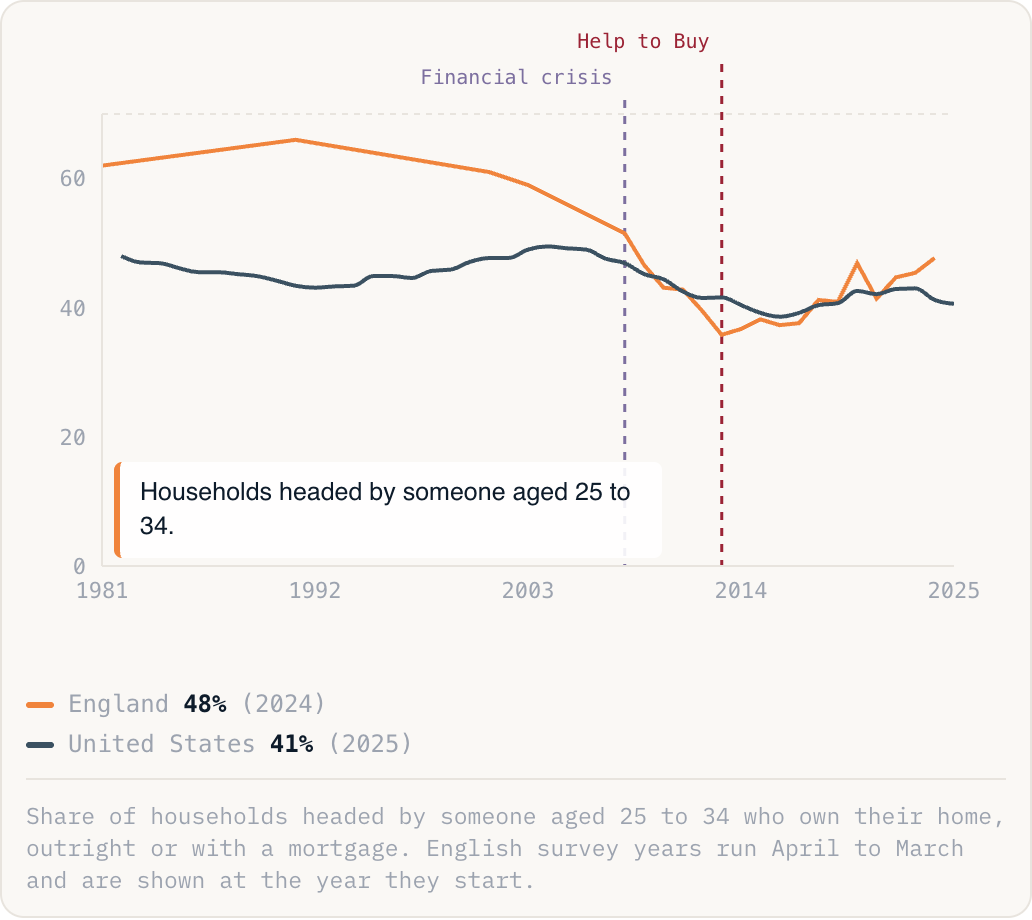
Households headed by someone aged 25 to 34.
England48%(2024)United States41%(2025)
Share of households headed by someone aged 25 to 34 who own their home, outright or with a mortgage. English survey years run April to March and are shown at the year they start.
Why this is happening
- Prices raced ahead of pay. A typical home in England cost about three and a half times a typical salary in 1997 and close to eight times in recent years. After 2008, banks also wanted far bigger deposits.
- The recovery came with help: Help to Buy loans from 2013 to 2023, cheap mortgages until 2022, and longer loans. Two in three young mortgage holders now owe for 30 years or more, and three in ten young buyers got money from family.
- The recent rise makes things look better than they are. The figures only count young people who have set up their own home, renting or owning. More people in their late twenties and early thirties now live with their parents, so they are left out.
The take
Owning a home while young has gone from normal to something most people do with help, from parents or from a 30-year mortgage. So whose family you come from decides more and more who owns, and owners then gain from rising prices that renters pay for. America shows a rebound is not automatic: its young own less than in 1982, and were slipping again in 2026.