MacroSnaps25 October 2026
No. 106Each person on earth is now fed from about 40% of the farmland it took in 1961, and eats better than they did then.
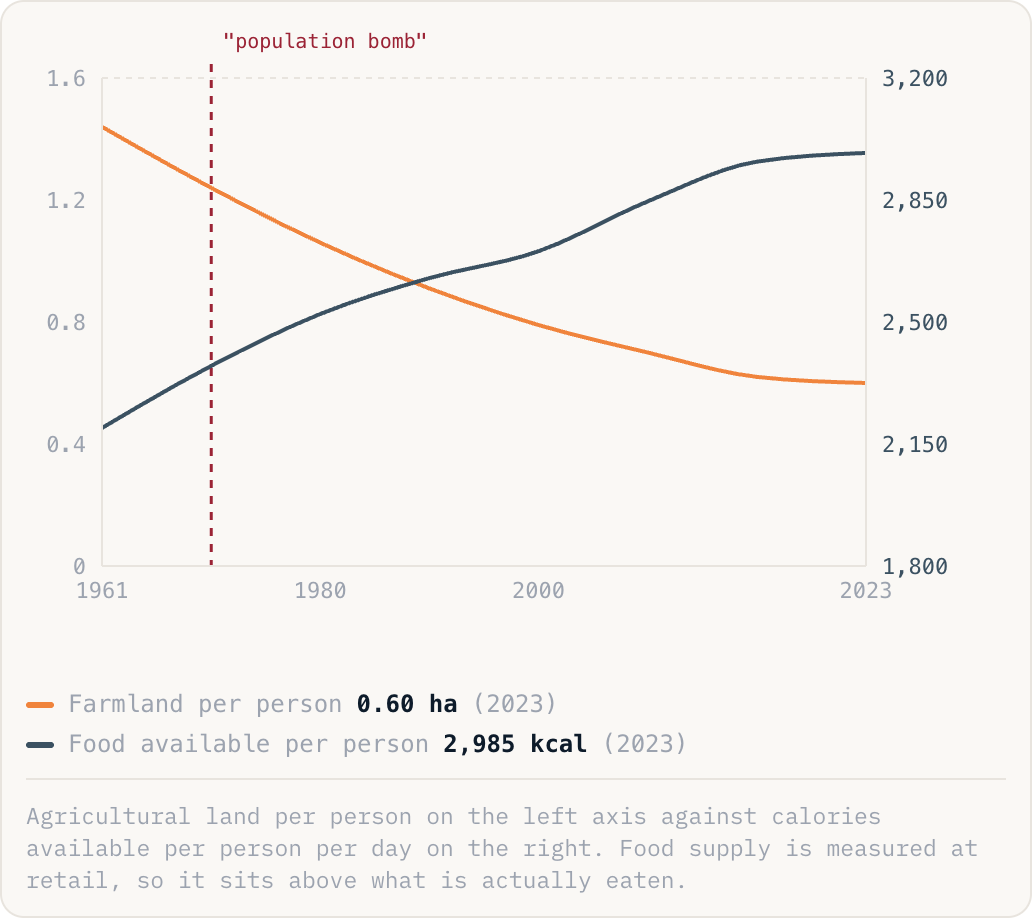
Farmland per person0.60 ha(2023)Food available per person2,985 kcal(2023)
Agricultural land per person on the left axis against calories available per person per day on the right. Food supply is measured at retail, so it sits above what is actually eaten.
Why this is happening
- Yields did it. World cereal yields have roughly tripled since 1961: better varieties, nitrogen fertiliser, irrigation, pesticides and machinery, the package usually called the green revolution.
- Norman Borlaug's dwarf wheat is the single clearest example. Introduced in Mexico, then India and Pakistan in the 1960s, it doubled harvests within a decade and is credited with averting famine on a continental scale.
- The gains are uneven. Yields in sub-Saharan Africa are still a fraction of Asian ones, mainly for lack of fertiliser, irrigation and roads, which is why the remaining hunger is concentrated there.
The take
Almost every famine forecast of the last 60 years assumed food production could not keep up with people, and every one was wrong for the same reason: they counted mouths and acres but not what an acre could be made to do. That is worth remembering when the next resource limit is declared, and it does not mean there is no limit, only that human ingenuity is a variable, not a constant.
Source: FAO, Our World in Data (2025)